
Search the Knowledge Base
Port Captain
Last Updated: 12. August 2026
Article Cluster: Fuel & Operational Efficiency
Applies to: PortCaptain
Author: Rick Broersma
About LionRock Maritime
LionRock Maritime provides highly accurate data and data-derived insights about tugboat operations across every port in the world. LionRock Maritime combines towage industry expertise, human creativity and data technologies to deliver decision-grade tugboat analytics software.
Executive Summary
-
Problem: Harbor towage operators compete for port contracts on the basis of operational performance, yet most have no reliable way to measure their own utilization against the operators they share a port with. Utilization, how many jobs each tug completes per day, is one of the strongest predictors of longterm commercial success in harbor towage, because it determines how much value a fleet extracts from a given number of assets. Without access to peer benchmarks calculated on a consistent methodology, an operator cannot know whether its performance is strong, average, or falling behind.
-
Solution: PortCaptain's Utilization Scoreboard calculates Jobs Per Tug Per Day as a normalized headline metric, enabling direct comparison across operators regardless of fleet size. Three driver metrics sit beneath the headline: Time Allocation, Operational Efficiency, and Fleet Capacity, each identifying a specific operational lever that crews and managers can act on.
-
Benchmarks: Jobs Per Tug Per Day is derived by dividing completed jobs in a period by active tugs and operational days. Time allocation segments are produced by AISbased job phase detection using our proprietary data model. Triangulation Rate and Average Transit Distance are calculated from the sequence and geometry of job legs, using standardized definitions applied equally to all operators within the same port.
-
Typical Impact: Operators using the scoreboard have gained visibility into how their fleet utilization compares with port peers, and have used the driver metrics to direct dispatch optimization efforts at the specific behaviors suppressing their score. The commercial view provided by the trend analysis supports contract discussions, giving operators an independently calculated performance record to present to port authorities and shipping customers.
Executive Answer
The Utilization Scoreboard captures the output of an entire fleet, normalized for size and time, in a form that is meaningful to an operations director, a port authority, and a commercial bid team alike. A fleet that completes more jobs per tug per day is extracting more productive work from the same assets, whether through better scheduling, smarter routing, or simply less time sitting at berth. But the headline score alone does not tell an operator what to do on Monday morning. For that, two layers of operational context are required. The first is time allocation: understanding how each tug's day is divided between not-sailing time at berth or anchorage, transit time moving between locations without an active job, and on-job time in direct productive work. More on-job time means more jobs. Less waiting means more on-job time. The second layer is routing efficiency. Within a port, the physical route between two points is largely fixed by geography; what varies is the dispatch pattern that determines which tug goes where and whether it returns to base between jobs. Average Transit Distance is reduced by three specific dispatch behaviors: not sailing tugs back to their home berth between assignments that can be chained; building a job portfolio concentrated in areas close to the operator’s tug station; and assigning the closest available tug to each incoming job. Triangulation Rate captures how consistently tugs move directly from one job to the next rather than repositioning to base. Together, these two metrics reveal whether dispatch decisions are keeping the fleet compact and continuously productive, or creating avoidable transit that displaces time and fuel from billable work. Together, these four views, the scoreboard, the time allocation breakdown, the routing efficiency analysis, and the fleet capacity comparison, give operators the full picture: where they stand, what is driving the result, and what operational behavior to change.
LionRock Maritime's PortCaptain Solution
The Scoreboard: Jobs Per Tug Per Day
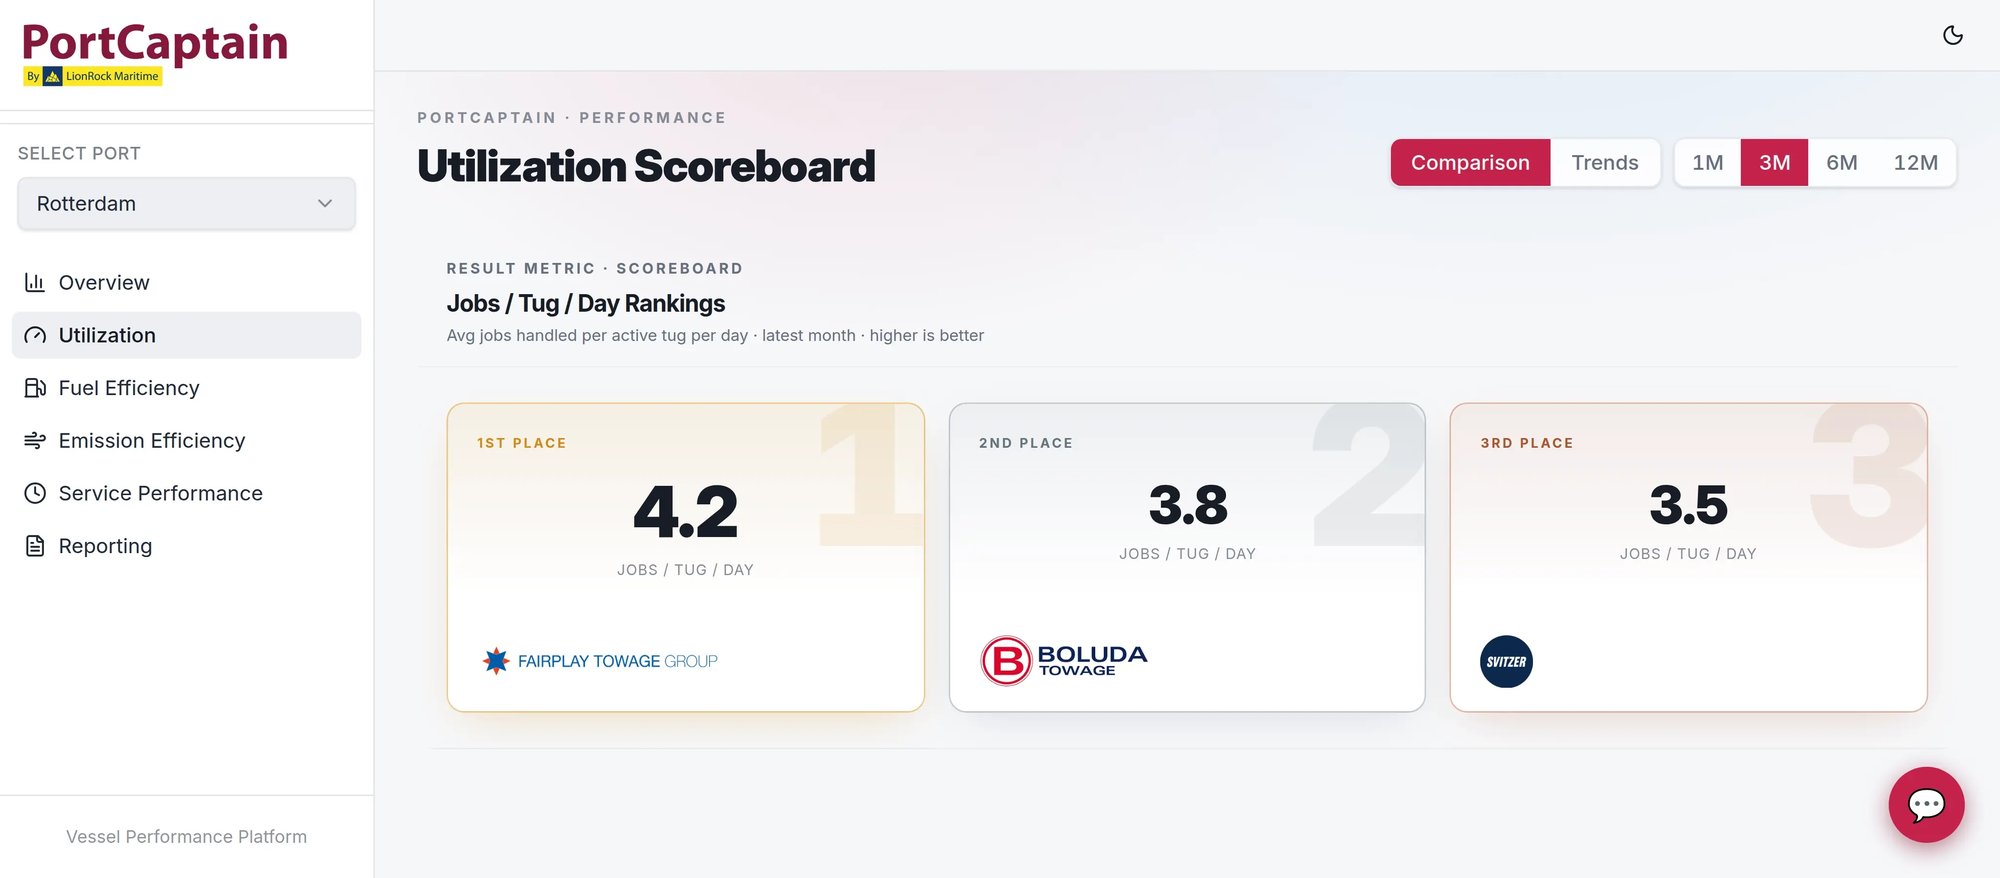
The headline metric normalizes fleet output across operators competing within the same port. Raw job counts alone are not a fair basis for comparison because they reflect fleet size as much as operational effectiveness - an operator running more tugs will typically complete more jobs, regardless of how efficiently those tugs are being used. Jobs Per Tug Per Day removes this distortion, leaving a single figure that reflects the productive output of an average tug over an average day. The scoreboard ranks all operators active in the selected port by this metric in a ranked podium view, showing which fleets complete more jobs per active tug and where gaps exist.
Driver 1: Time Allocation
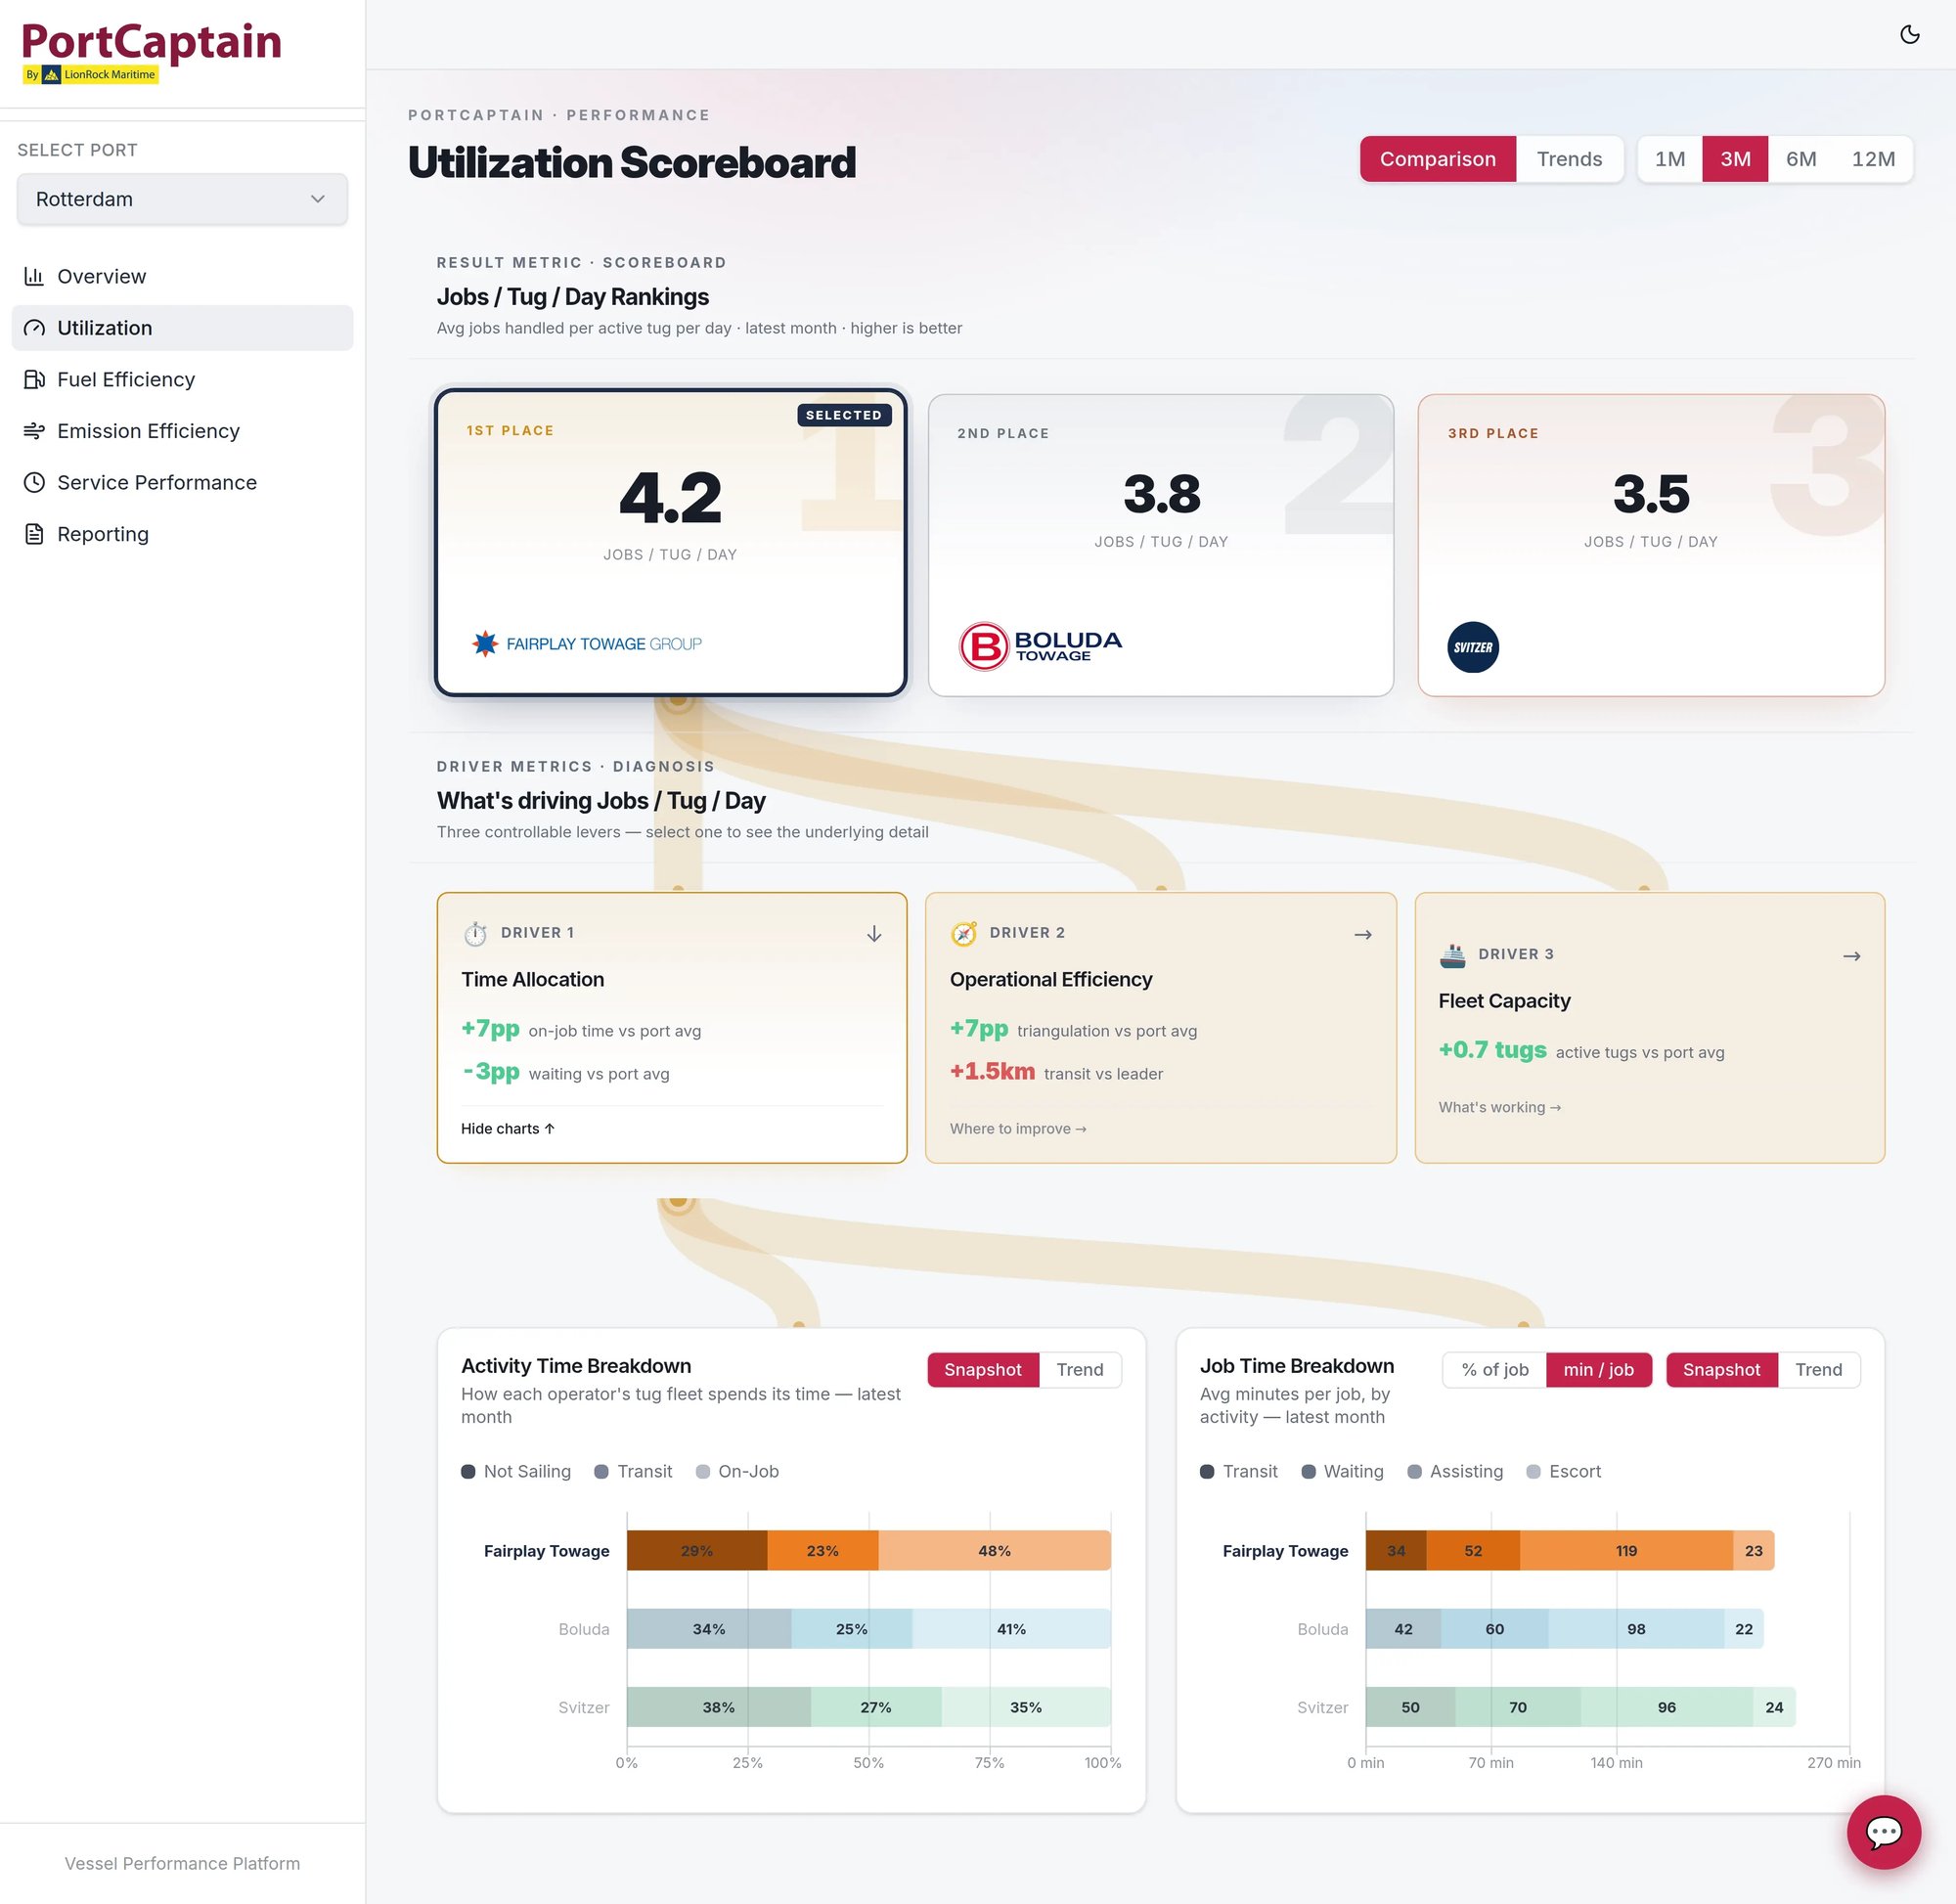
Time allocation breaks the operational day into three segments: Not Sailing, Transit, and On-Job. Within the on-job portion, a further split separates transit-to-job time, waiting time, assisting time, and escort time expressed in average minutes per job, giving managers a layered view of how productive hours are structured.
Not Sailing time is time spent at berth, anchorage, or mooring without active dispatch. Some amount of standby time is inherent to harbor towage - tugs must be available at short notice and cannot be continuously deployed. Extended not-sailing periods relative to peer operators indicate scheduling patterns, berth allocation decisions, or crew handover routines that are consuming operational capacity without producing jobs.
Transit time covers movement between locations without an active job in progress, including lightsailing to and from job sites and repositioning between assignments. Transit is operationally necessary but commercially unproductive. High transit time relative to on-job time suggests that job sequencing is not optimizing tug routing, that tugs are returning to base between assignments that could be chained, or that distances between the fleet's operating locations are imposing a structural penalty.
On-Job time is the productive core. Higher on-job time means more jobs completed per tug per day. Within on-job time, the per-job minute breakdown reveals whether time is being consumed in pre-job coordination or whether tugs are moving quickly from arrival to active work. High waiting time within jobs points to coordination patterns with vessels, pilots, or port traffic that can be analyzed and potentially reduced.
Driver 2: Operational Efficiency
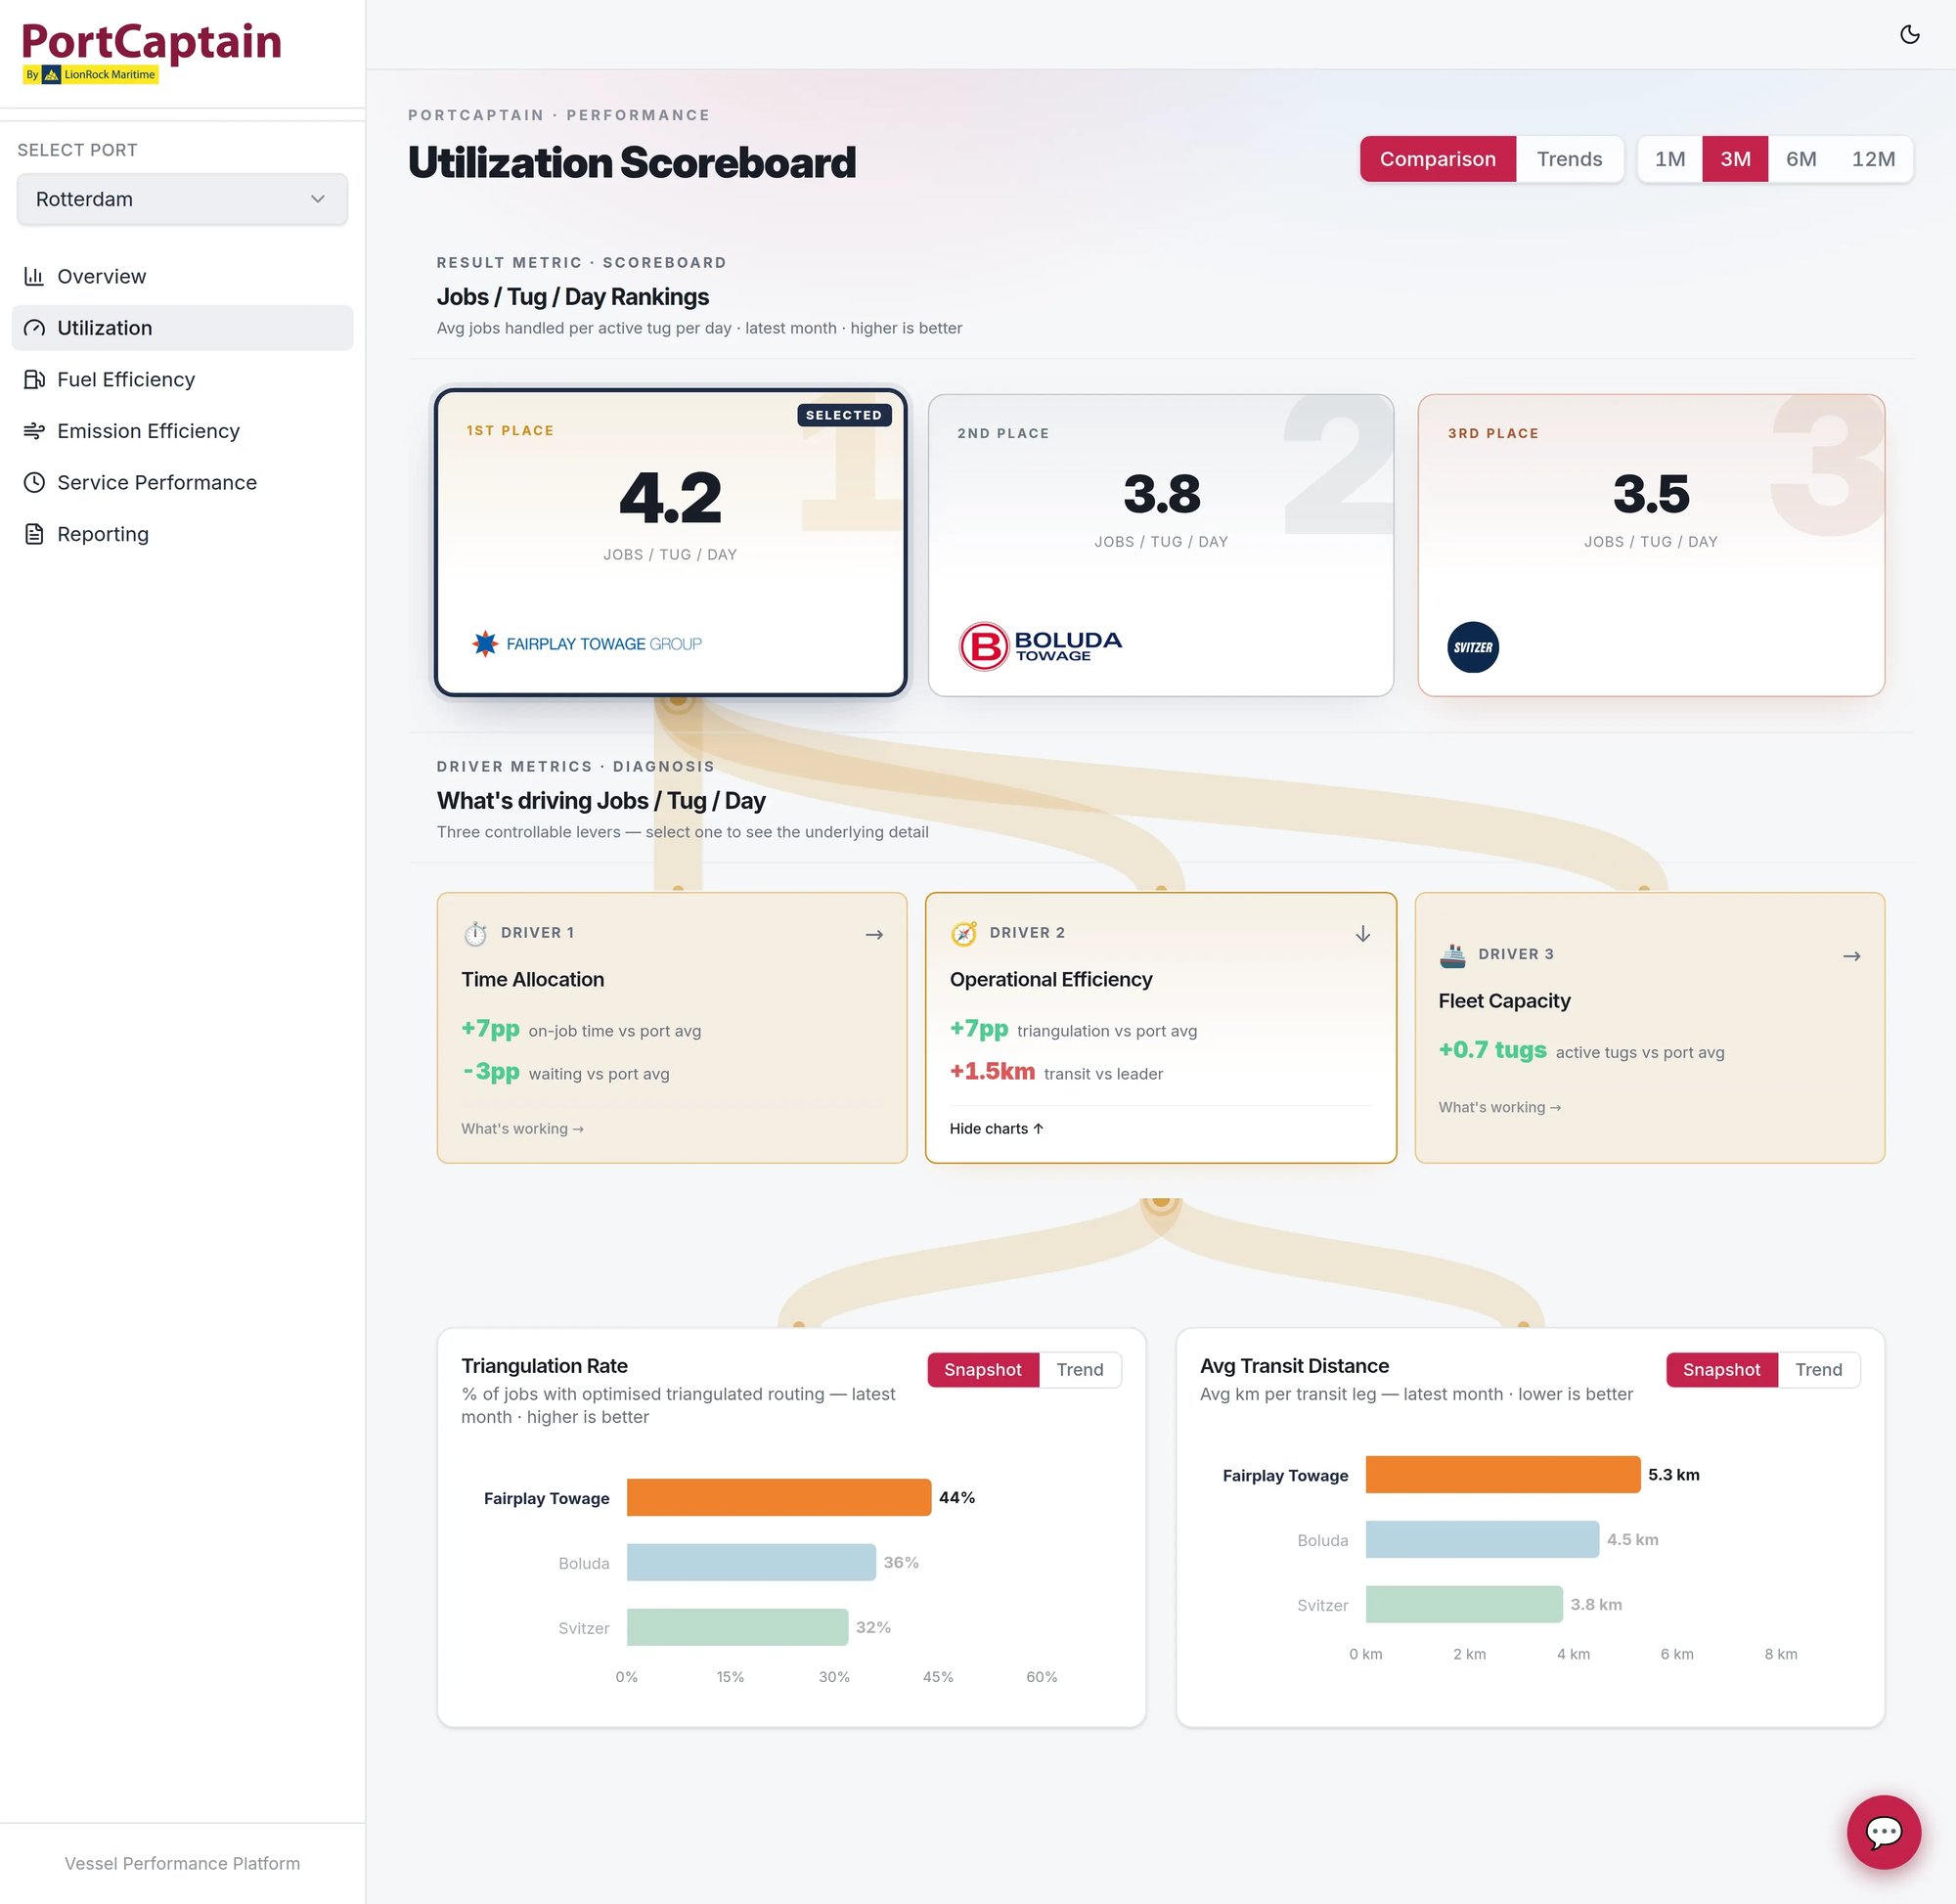
Operational efficiency is measured through two complementary metrics: Triangulation Rate and Average Transit Distance per leg.
Triangulation Rate is the proportion of jobs completed using optimised triangulated routing, where a tug moves from one job directly to the next without an intervening return to base. A higher Triangulation Rate indicates more efficient dispatch sequencing, reducing repositioning between jobs. A low Triangulation Rate in a port where job density would support chaining suggests that dispatch practices or scheduling systems are not sequencing jobs efficiently.
Average Transit Distance per leg is the mean kilometres covered in each transit leg across all jobs. Within a port, route geometry is largely fixed, so transit distance is shaped primarily by dispatch decisions rather than individual navigation. The three principal levers for reducing average transit distance are: ensuring tugs do not sail back to their home berth between jobs that could be chained; building a job portfolio concentrated in areas close to the tug station; and consistently assigning the closest available tug to each incoming job. Operators with lower average transit distances typically demonstrate stronger discipline across all three of these dispatch behaviors.
These two metrics interact. A fleet with a high Triangulation Rate but also a high Average Transit Distance may be chaining jobs but choosing inefficient sequences. A fleet with low transit distances but low Triangulation Rate may be routing individual legs efficiently while returning unnecessarily to base between assignments.
Driver 3: Fleet Capacity
Fleet Capacity measures how many active tugs each operator is deploying relative to the port average. This metric contextualises the Jobs Per Tug Per Day score by revealing whether productivity differences reflect operational behavior or structural fleet deployment decisions.
An operator deploying more active tugs than the port average may be absorbing more of the available job flow, but if the per-tug productivity score is lower, that fleet is using more assets to achieve proportionally less output.
The Fleet Capacity driver sits alongside Time Allocation and Operational Efficiency to provide a complete picture of how fleet size, time use, and routing combine to produce the headline score. An operator can use it to assess whether adding a vessel would raise total job throughput or simply dilute the per-tug metric without changing underlying utilization patterns.
Metric Trends
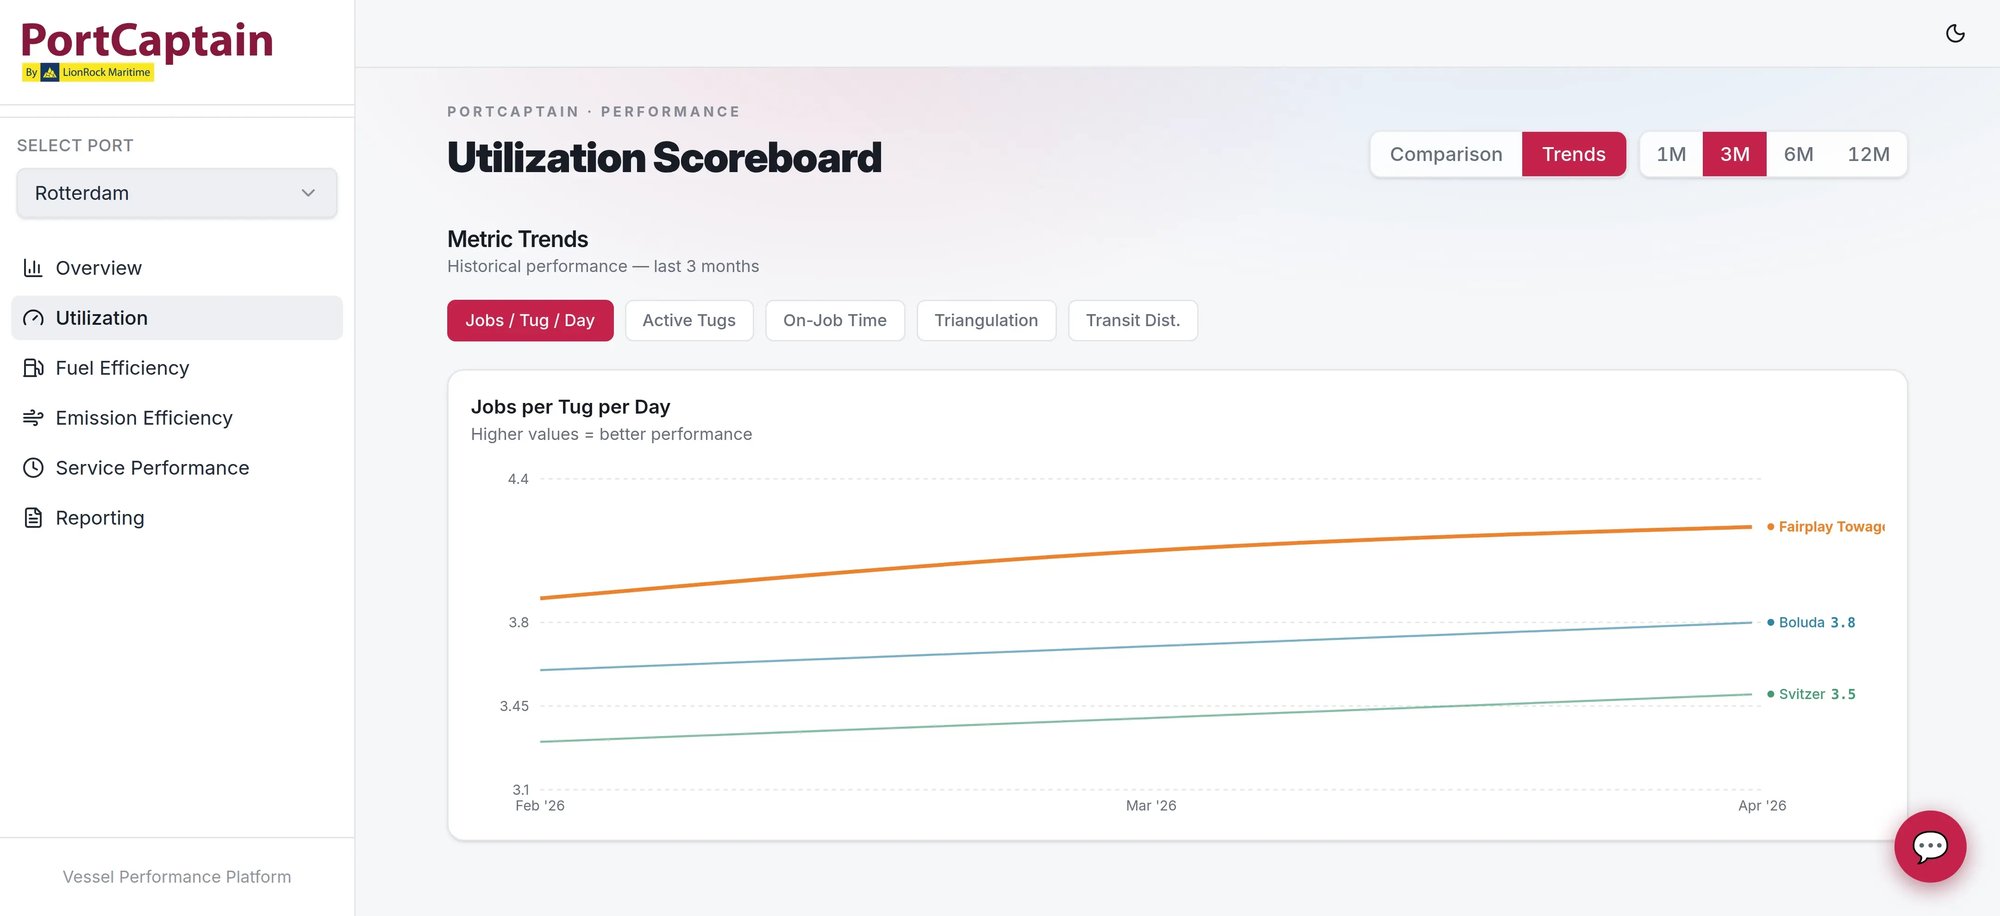
The Metric Trends view tracks all five headline figures - Jobs Per Tug Per Day, Active Tugs, On-Job Time, Triangulation Rate, and Transit Distance - month over month using selectable metric tabs.
A rising Jobs Per Tug Per Day score over successive months indicates that operational changes are taking effect. Driver metrics tracked in the same view show which specific behaviors are contributing to the change, and reveal the lag between an operational adjustment and its effect on the headline score.
The view shows whether performance is improving, stable, or declining, and provides early warning before a period of underperformance becomes a sustained trend.
Proven Results
Operators using the Fleet Productivity Scoreboard have identified gaps between their normalized output and port peers, and have used the driver metrics to prioritize improvement efforts. Time allocation analysis has identified vessel assignments where not-sailing time was above the fleet average. Routing efficiency analysis has identified chaining opportunities in ports where dispatch practices were not sequencing jobs efficiently. The trend view provides a month-over-month performance record against port peers.
Get started with your Tugboat Analytics today!
Common Issues
The following operational patterns most frequently explain below-average Jobs Per Tug Per Day scores and the driver metrics that underpin them:
- Tug scheduling that assigns standby positions based on habit or convenience rather than proximity to the most likely next job, increasing both not-sailing and transit time
- Dispatch logic that returns tugs to a home berth between assignments rather than holding them at or near the location of the next expected job
- Absence of systematic job sequencing that considers geographic proximity when assigning the next job to an available tug
- High pre-job waiting time driven by coordination gaps between dispatch, pilots, and vessels, consuming on-job time without productive output
- Dispatch practices that assign jobs without considering which tug is geographically closest, or that do not account for the concentration of the job portfolio relative to the tug station.
- Reporting that measures total jobs or total active hours without normalizing for fleet size, masking productivity differences between operating periods of different intensity
- No structured month-over-month tracking of driver metrics, meaning individual improvements are not visible as part of a broader performance trend
Solution Overview: Improving Fleet Productivity Using the Scoreboard
Fuel measurement becomes powerful when it is linked to business decisions. The four dashboards shown above represent the core strategic use cases.
Step 1: Establish the baseline Jobs Per Tug Per Day score
Open the PortCaptain Utilization Scoreboard for the relevant port and select the reporting window (1M, 3M, 6M, or 12M). Note the operator's rank position and score relative to the port's other active operators. Identify where the score sits and how large the gap to the leading operator is. The baseline establishes the starting point for improvement tracking and the reference against which driver analysis should be interpreted.
Step 2: Expand Driver 1 - Time Allocation - to identify the primary drag on productivity
Select the Time Allocation driver card to reveal the Activity Time Breakdown and Job Time Breakdown charts. Review the three-way split of Not Sailing, Transit, and On-Job time for the fleet and compare it against peer operators in the same port. If Not Sailing is high relative to peers, the improvement lever is scheduling and standby positioning. If Transit is high, the lever is routing and job sequencing. Within on-job time, check the per-job minute split between transit-to-job, waiting, assisting, and escort. High waiting minutes per job points to pre-job coordination patterns that can be addressed without changing fleet size or berth assignment.
Step 3: Expand Driver 2 - Operational Efficiency - to assess routing behavior
Select the Operational Efficiency driver card to reveal the Triangulation Rate and Average Transit Distance charts. Compare both metrics against peer operators in the same port. Where Triangulation Rate is below the port group, assess whether tugs are returning to base between assignments that could be chained, and whether dispatch systems or practices are preventing sequential job allocation. Where Average Transit Distance is above the port average, examine the three dispatch levers: base return patterns between jobs, the geographic concentration of the job portfolio relative to the tug station, and whether closest-tug assignment is being consistently applied. Assess the combination of both metrics: high triangulation with high transit distance may indicate chaining is occurring but sequences are not yet optimally ordered.
Step 4: Review Driver 3 - Fleet Capacity - to contextualise the productivity score
Select the Fleet Capacity driver card to compare active tug deployment against the port average. Determine whether the operator's Jobs Per Tug Per Day score reflects intensive deployment of a lean fleet or average output from a larger one. Use this context when assessing whether the improvement pathway involves operational behavior change or fleet deployment decisions.
Step 5: Track all metrics month over month to establish a performance trajectory
Switch to the Trends view and cycle through the five metric tabs: Jobs / Tug / Day, Active Tugs, On-Job Time, Triangulation, and Transit Dist. Use the trend view to assess whether operational changes introduced during the period are producing visible improvements in the headline score and its drivers.
Evidence & Governance
PortCaptain Utilization Scoreboard metrics are derived from AIS position data and TugIO job phase detection, applied consistently across all operators and ports in the platform. Jobs Per Tug Per Day normalization uses confirmed fleet size and operational day counts for the reporting period. Time allocation segmentation uses the same phase detection logic as the TugIO job timestamp model, ensuring consistency between the scoreboard and job-level analytics.
Triangulation Rate and Average Transit Distance are calculated from the sequence and geometry of job legs within the reporting period, using standardized definitions applied equally to all operators. The consistent methodology ensures that scoreboard comparisons reflect real operational differences rather than artifacts of inconsistent measurement.
All metrics are calculated on the same data source and updated on the same schedule, ensuring that the scoreboard, driver metrics, and trend view present a coherent picture of fleet performance rather than figures that reflect different underlying datasets.
Key KPI Definitions
- Jobs Per Tug Per Day The total number of completed jobs in a period divided by the number of active tugs and the number of operational days. Normalizes fleet output for fleet size and reporting period length, enabling fair comparison across operators and time periods.
- Not Sailing Time (%) The proportion of the operational day during which tugs are at berth, anchorage, or mooring without active dispatch. Reflects the balance between necessary standby availability and recoverable idle time that could be converted into productive jobs.
- Transit Time (%) The proportion of the operational day spent in lightsailing or repositioning movement without an active job in progress. High transit proportions relative to peer operators indicate routing or sequencing inefficiency.
- On-Job Time (%) The proportion of the operational day spent in active job execution, including waiting for job start, the assist leg, and any escort component. The direct determinant of Jobs Per Tug Per Day: more on-job time means more jobs per tug.
- Triangulation Rate (%) The share of completed jobs where the tug proceeded directly from one job to the next without an intervening return to base or extended repositioning. Higher values indicate chained dispatch with less repositioning between assignments.
- Average Transit Distance per Leg (km) The mean kilometres covered in each transit leg across all jobs in the period. Within a port, transit distance is driven primarily by dispatch decisions, whether tugs return to base between chainable jobs, how concentrated the job portfolio is near the tug station, and whether the closest available tug is assigned to each job. Lower values indicate stronger discipline across these three dispatch behaviors.
- Active Tugs vs Port Average The number of actively deployed tugs for the operator compared to the port average across all operators in the period. Used to contextualise the Jobs Per Tug Per Day score by distinguishing productivity differences driven by fleet size from those driven by operational behavior.
- Waiting Time within Job (min/job) The average minutes per job spent waiting between tug arrival alongside and the start of the active assist. High waiting averages indicate pre-job coordination inefficiency that is consuming productive capacity without output.
Do you still have questions?
Contact our support via email
Frequently Asked Questions
Why is normalizing by fleet size necessary, can't we just compare total jobs completed?
Total job counts reflect fleet size as much as they reflect operational effectiveness. An operator running twelve tugs will almost always complete more jobs than an operator running six, even if the larger fleet is significantly less efficient per vessel. Jobs Per Tug Per Day removes this effect, so what remains is a genuine signal about how well each asset is being utilized. Normalizing by fleet size allows meaningful comparison between operators regardless of how many vessels each deploys.
How does Triangulation Rate connect to fuel savings as well as productivity?
Every transit leg a tug completes consumes fuel, whether or not it produces a billable job. A tug that returns to base between assignments that could have been chained burns fuel on two transit legs where one would have been sufficient. Triangulation Rate captures the frequency with which that avoidable fuel burn is happening across the fleet. Improving Triangulation Rate therefore has a compound benefit: it raises Jobs Per Tug Per Day by reducing unproductive transit time, and it reduces fuel consumption per job by shortening the total distance sailed per job cycle. Both effects improve operational economics simultaneously.
How should we use the time allocation breakdown to prioritize operational changes?
The time allocation split tells you where in the day time is being lost relative to peer operators. If Not Sailing time is the outlier, the priority is scheduling: reviewing standby berth positions, shift handover timing, and dispatch responsiveness. If Transit time is the outlier, the priority is routing: examining job sequencing, chaining practices, and whether tugs are being held near the next likely job location rather than returned to base. The on-job waiting split then identifies whether there is a further layer of pre-job coordination improvement available once the structural time allocation has been addressed.
How should we present the Metric Trends view to a client or board audience?
One approach is to anchor the trend on a specific operational change and note the lag between the change and its appearance in the headline score. For example, if a routing protocol change was introduced in month four, the trend view will show whether Triangulation Rate and Jobs Per Tug Per Day moved in subsequent months. The trend view also shows early signs of declining performance.