Captain Fuel Index - FuelExplorer - LionRock Maritime Resource

Reports: FuelExplorer

Captain Fuel Index

Turning captain training into Cost Savings and Sustainability Gains


The Captain Fuel Index provides powerful fleet-wide and individual-level insights into these fuel consumption patterns. It tracks captain performance across job phases, visualizes key consumption trends, and integrates job playback data for a full picture of operational fuel use. These comprehensive insights allow managers to identify improvement areas, reduce fuel costs, and boost sustainability performance throughout port operations.

LionRock Crane Icon
+

Ports Explored

LionRock fuel Icon
€   +

Worldwide Annual Cost Savings

LionRock co2 icon
KG   +

KGs of CO2 saved

Report overview

How the Captain Fuel Index can help your business

This report showcases an example analysis using LionRock Maritime’s Captain Fuel Index, demonstrating how tugboat operators and managers can monitor and optimize fuel usage across fleet and captain levels. The dashboard provides a granular view of fuel use per captain, highlights patterns of fuel demand across job phases, and integrates playback data to contextualize fuel usage during specific maneuvers.

These insights reveal where fuel efficiencies can be gained and which captains or job types require targeted adjustments. With this data, operators can better manage fuel costs, enhance operational efficiency, and reduce emissions. The result? A more accountable, sustainable, and cost-effective fleet—ready to meet port demands while maintaining a sharp eye on fuel performance.

4.2.1_Fuel_use_by_captain copy

Insight 1

Fuel use by captain

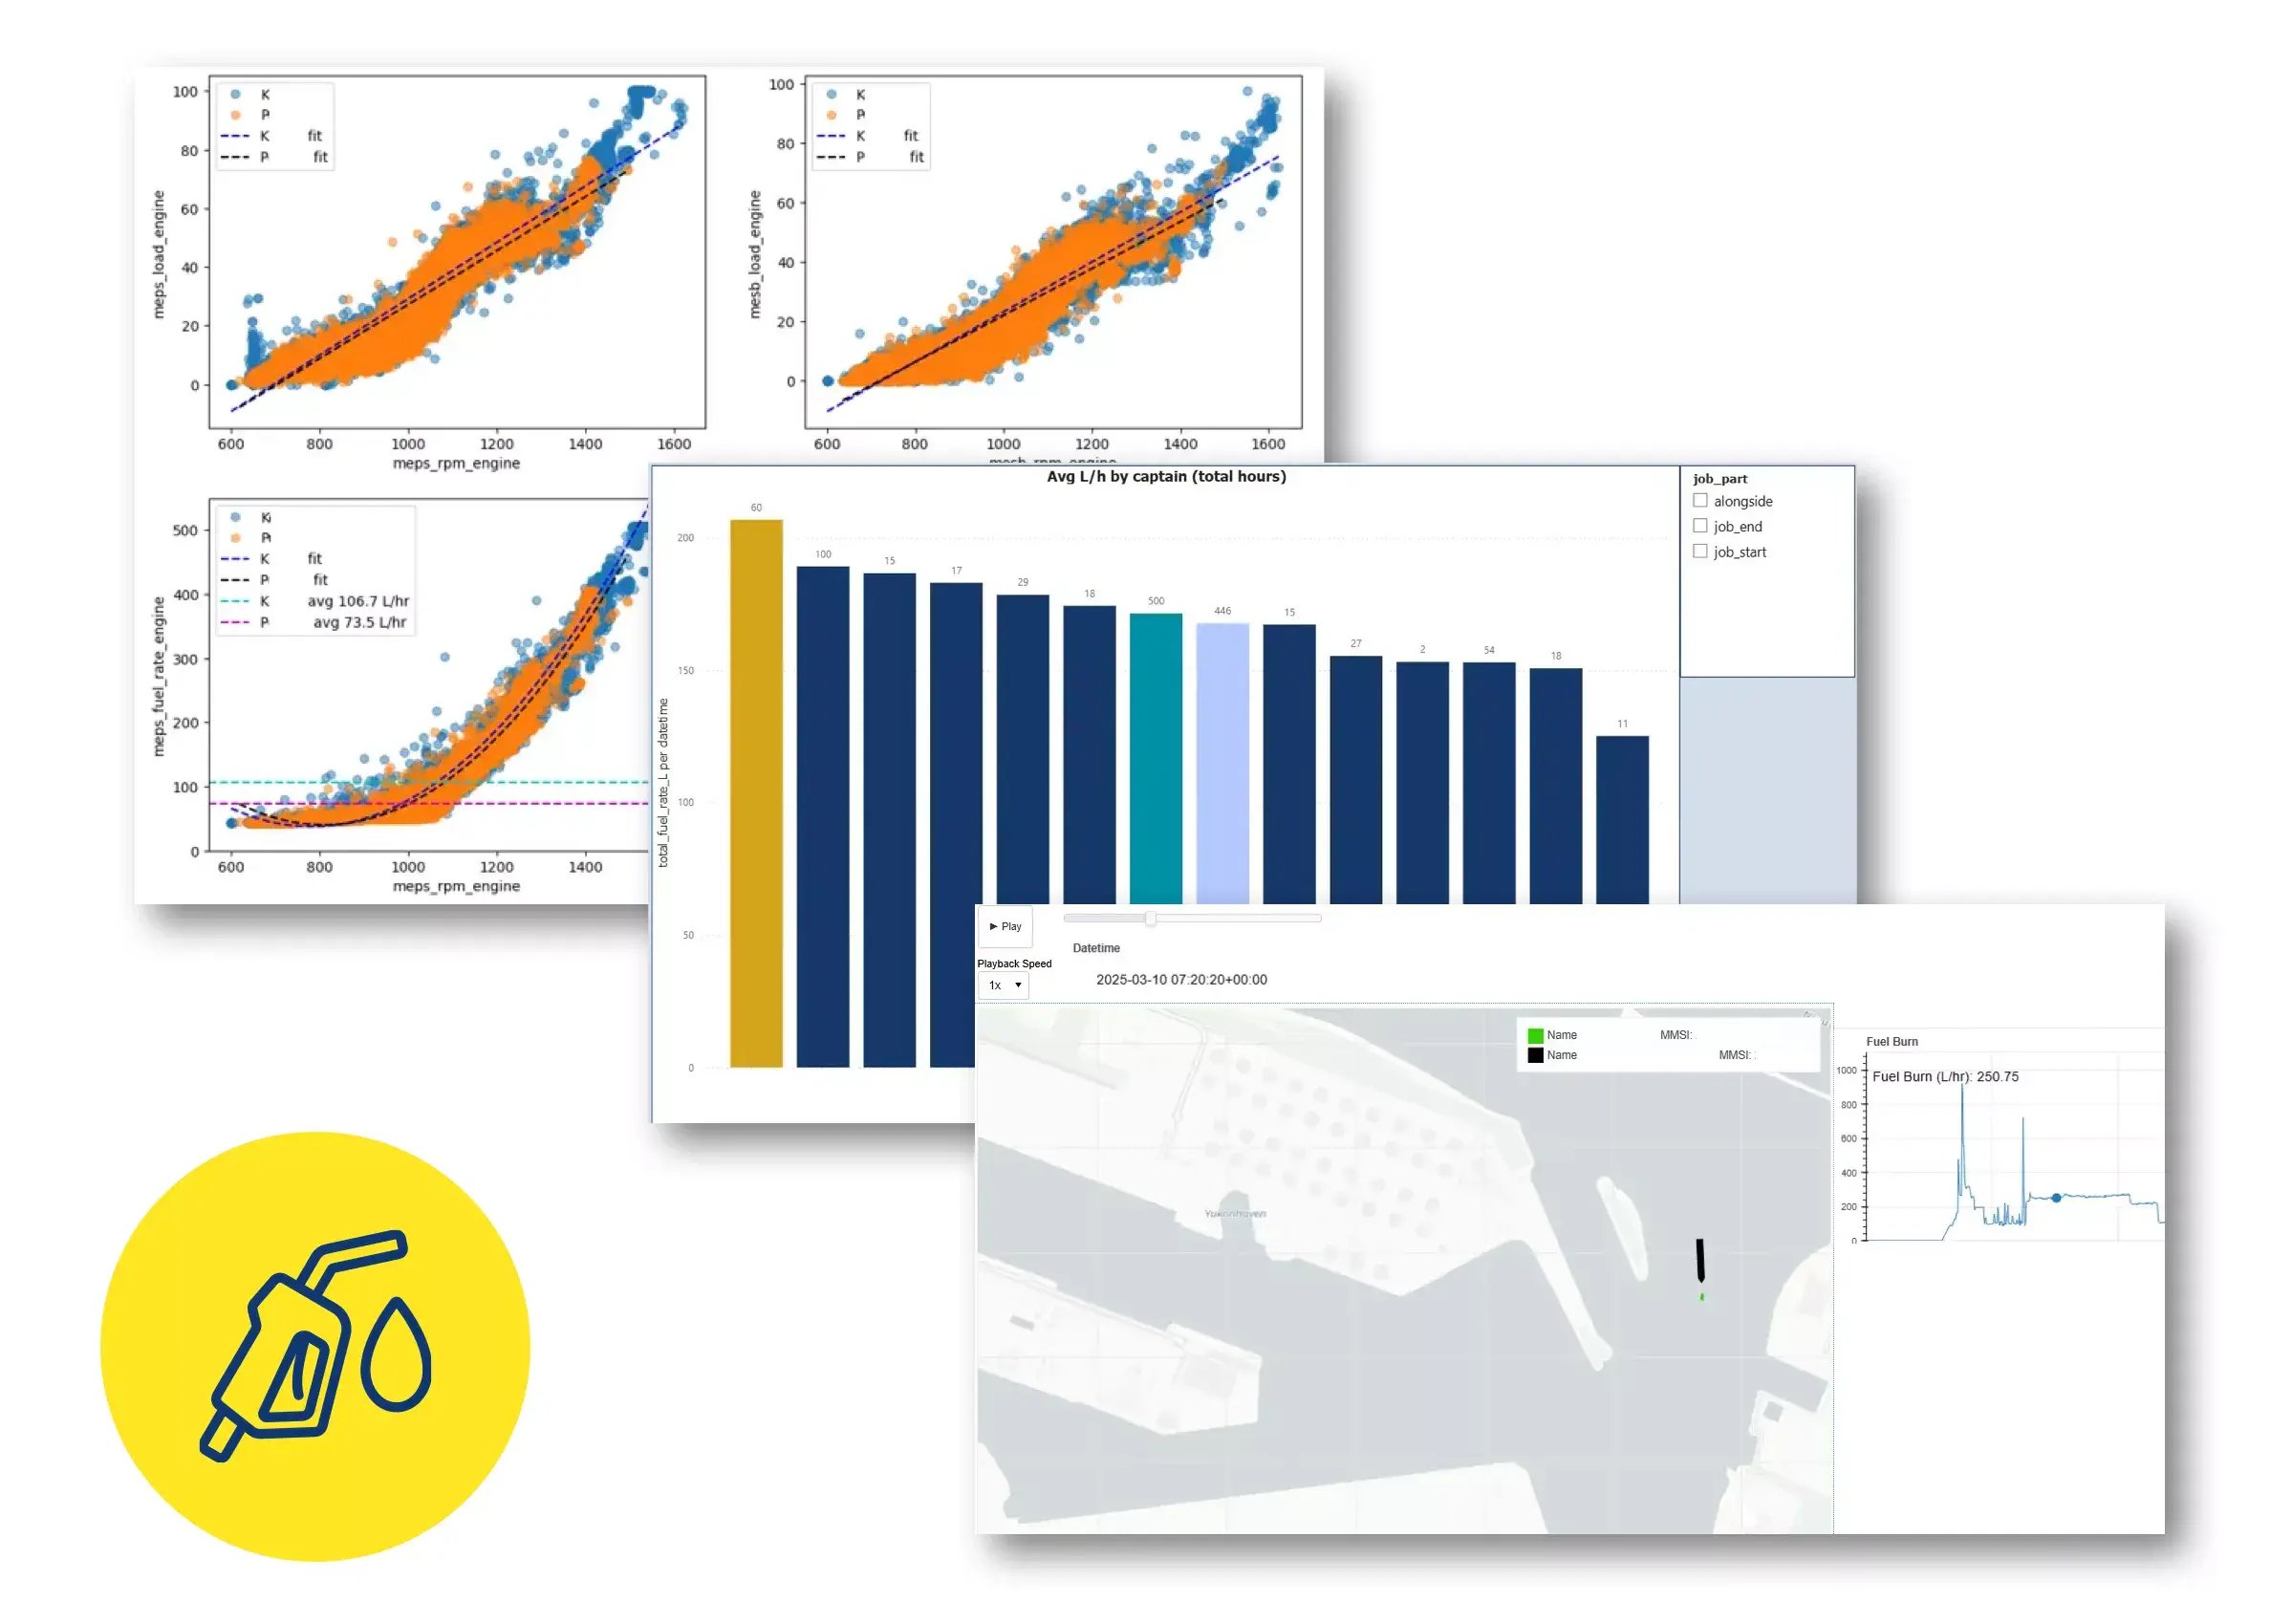
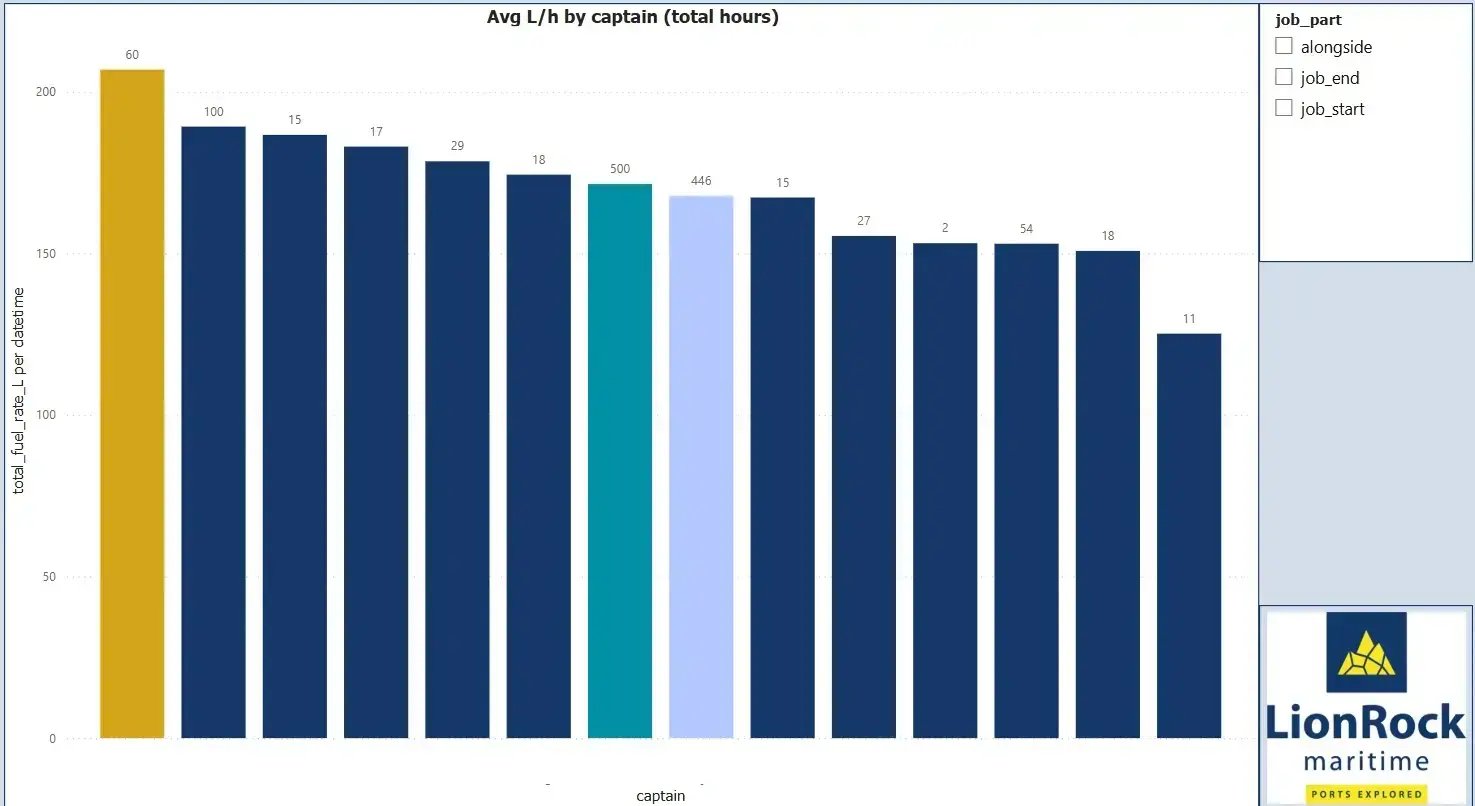
This visualization offers a comparative analysis of average fuel consumption (L/h) by captain across their total hours of operation. The bar chart reveals significant variations in fuel use per captain, providing a clear indicator of individual operating patterns and efficiency.

For instance, one captain's fuel consumption peaks at approximately 200 L/h, while others operate with much lower averages. Such differences can highlight behavioral patterns, including variations in sailing practices, maneuvering techniques, and adherence to eco-efficient speed guidelines. By identifying high-consumption captains, port managers and fleet operators can target coaching, training, or operational adjustments to reduce fuel waste and enhance sustainability.

Moreover, this captain-level perspective empowers decision-makers to prioritize performance improvements where they can yield the greatest impact—driving down fuel costs and boosting operational efficiency.

4.2.2_Fuel_consumption_analytics

Insight 2

Fuel consumption analytics

We provide detailed analysis and insights into tug control and according fuel consumptions by captains. I.e. how do different captains manoeuver teh tug in comparable conditions and what can be learned from it for a better fuel economy. Where insight 1 above gives a snapshot view about average levels of fuel consumption, our Fuel consumption analytics suite dives into understanding the details behind it.

4.2.3_Job_playbacks_including_fuel_use

Insight 3

Job playbacks including fuel use

This dashboard insight enables dynamic, time-based playback of individual tug jobs—integrating vessel movement tracking with real-time fuel consumption data. It provides a clear visual correlation between tug maneuvers and fuel usage, illustrating exactly when and where fuel was consumed throughout the job’s duration.

By revealing fuel burn spikes during specific maneuvers or transit segments, this feature helps port managers and operators identify operational patterns, refine job execution strategies, and adopt more fuel-conscious practices. Over time, these playbacks become a powerful tool to inform job planning, boost sustainability efforts, and ensure every vessel movement aligns with environmental and operational best practices.

Included Reports

Insights we provide:

  • Fuel use by captain
  • Fuel consumption analytics
  • Job playbacks including fuel use