4_1 Fuel Pricing Tool Dashboard - FuelExplorer - LionRock Maritime Resource

Reports: FuelExplorer

Fuel Pricing Tool

Getting accurate fuel cost insight for better commercial decisions


Fuel cost are often a significant component of tugboat operational cost, yet there is often no transparency on how different customers drive up this cost. The Fuel Pricing Tool provides fleet-wide insights into these fuel consumption patterns, visualizing pricing implications and cost breakdowns for better commercial decisions.

LionRock Crane Icon
+

Ports Explored

LionRock fuel Icon
€   +

Worldwide Annual Cost Savings

LionRock co2 icon
KG   +

KGs of CO2 saved

Report overview

How the Fuel Pricing Tool can help your business

This report showcases an example analysis using  Fuel Pricing Tool, powered by LionRock Maritime, to demonstrate how real-time fuel cost data can be monitored and utilized for better commercial decisions. The dashboard tracks fuel consumption patterns across fleet, terminals and customers, highlighting fuel spending patterns and real cost allocation.


4.1.1_Fuel_cost_by_customer copy

Insight 1

Fuel cost by customer

This visualization highlights the fuel consumption patterns across different customers, providing a detailed breakdown of litres of fuel used by each customer over a range of job types and job segments. The stacked bar chart showcases total fuel usage—ranging from berth operations, sailing, and transits to shifts between or within terminals—offering a clear and comparative view of operational intensity across customers.

The left side of the graph reveals a few customers with notably higher fuel consumption. As the chart moves to the right, fuel usage becomes more balanced and evenly spread across the customer base, suggesting more consistent or smaller-scale service demands.

For port operators and fleet planners, this insight is crucial for identifying high-volume customers that drive the greatest fuel usage and associated costs. Such data empowers proactive decision-making around operational efficiencies, pricing structures, and resource allocation—ultimately supporting sustainable and cost-effective port operations.

4.1.2_Fuel_cost_by_terminal copy

Insight 2

Fuel cost by terminal

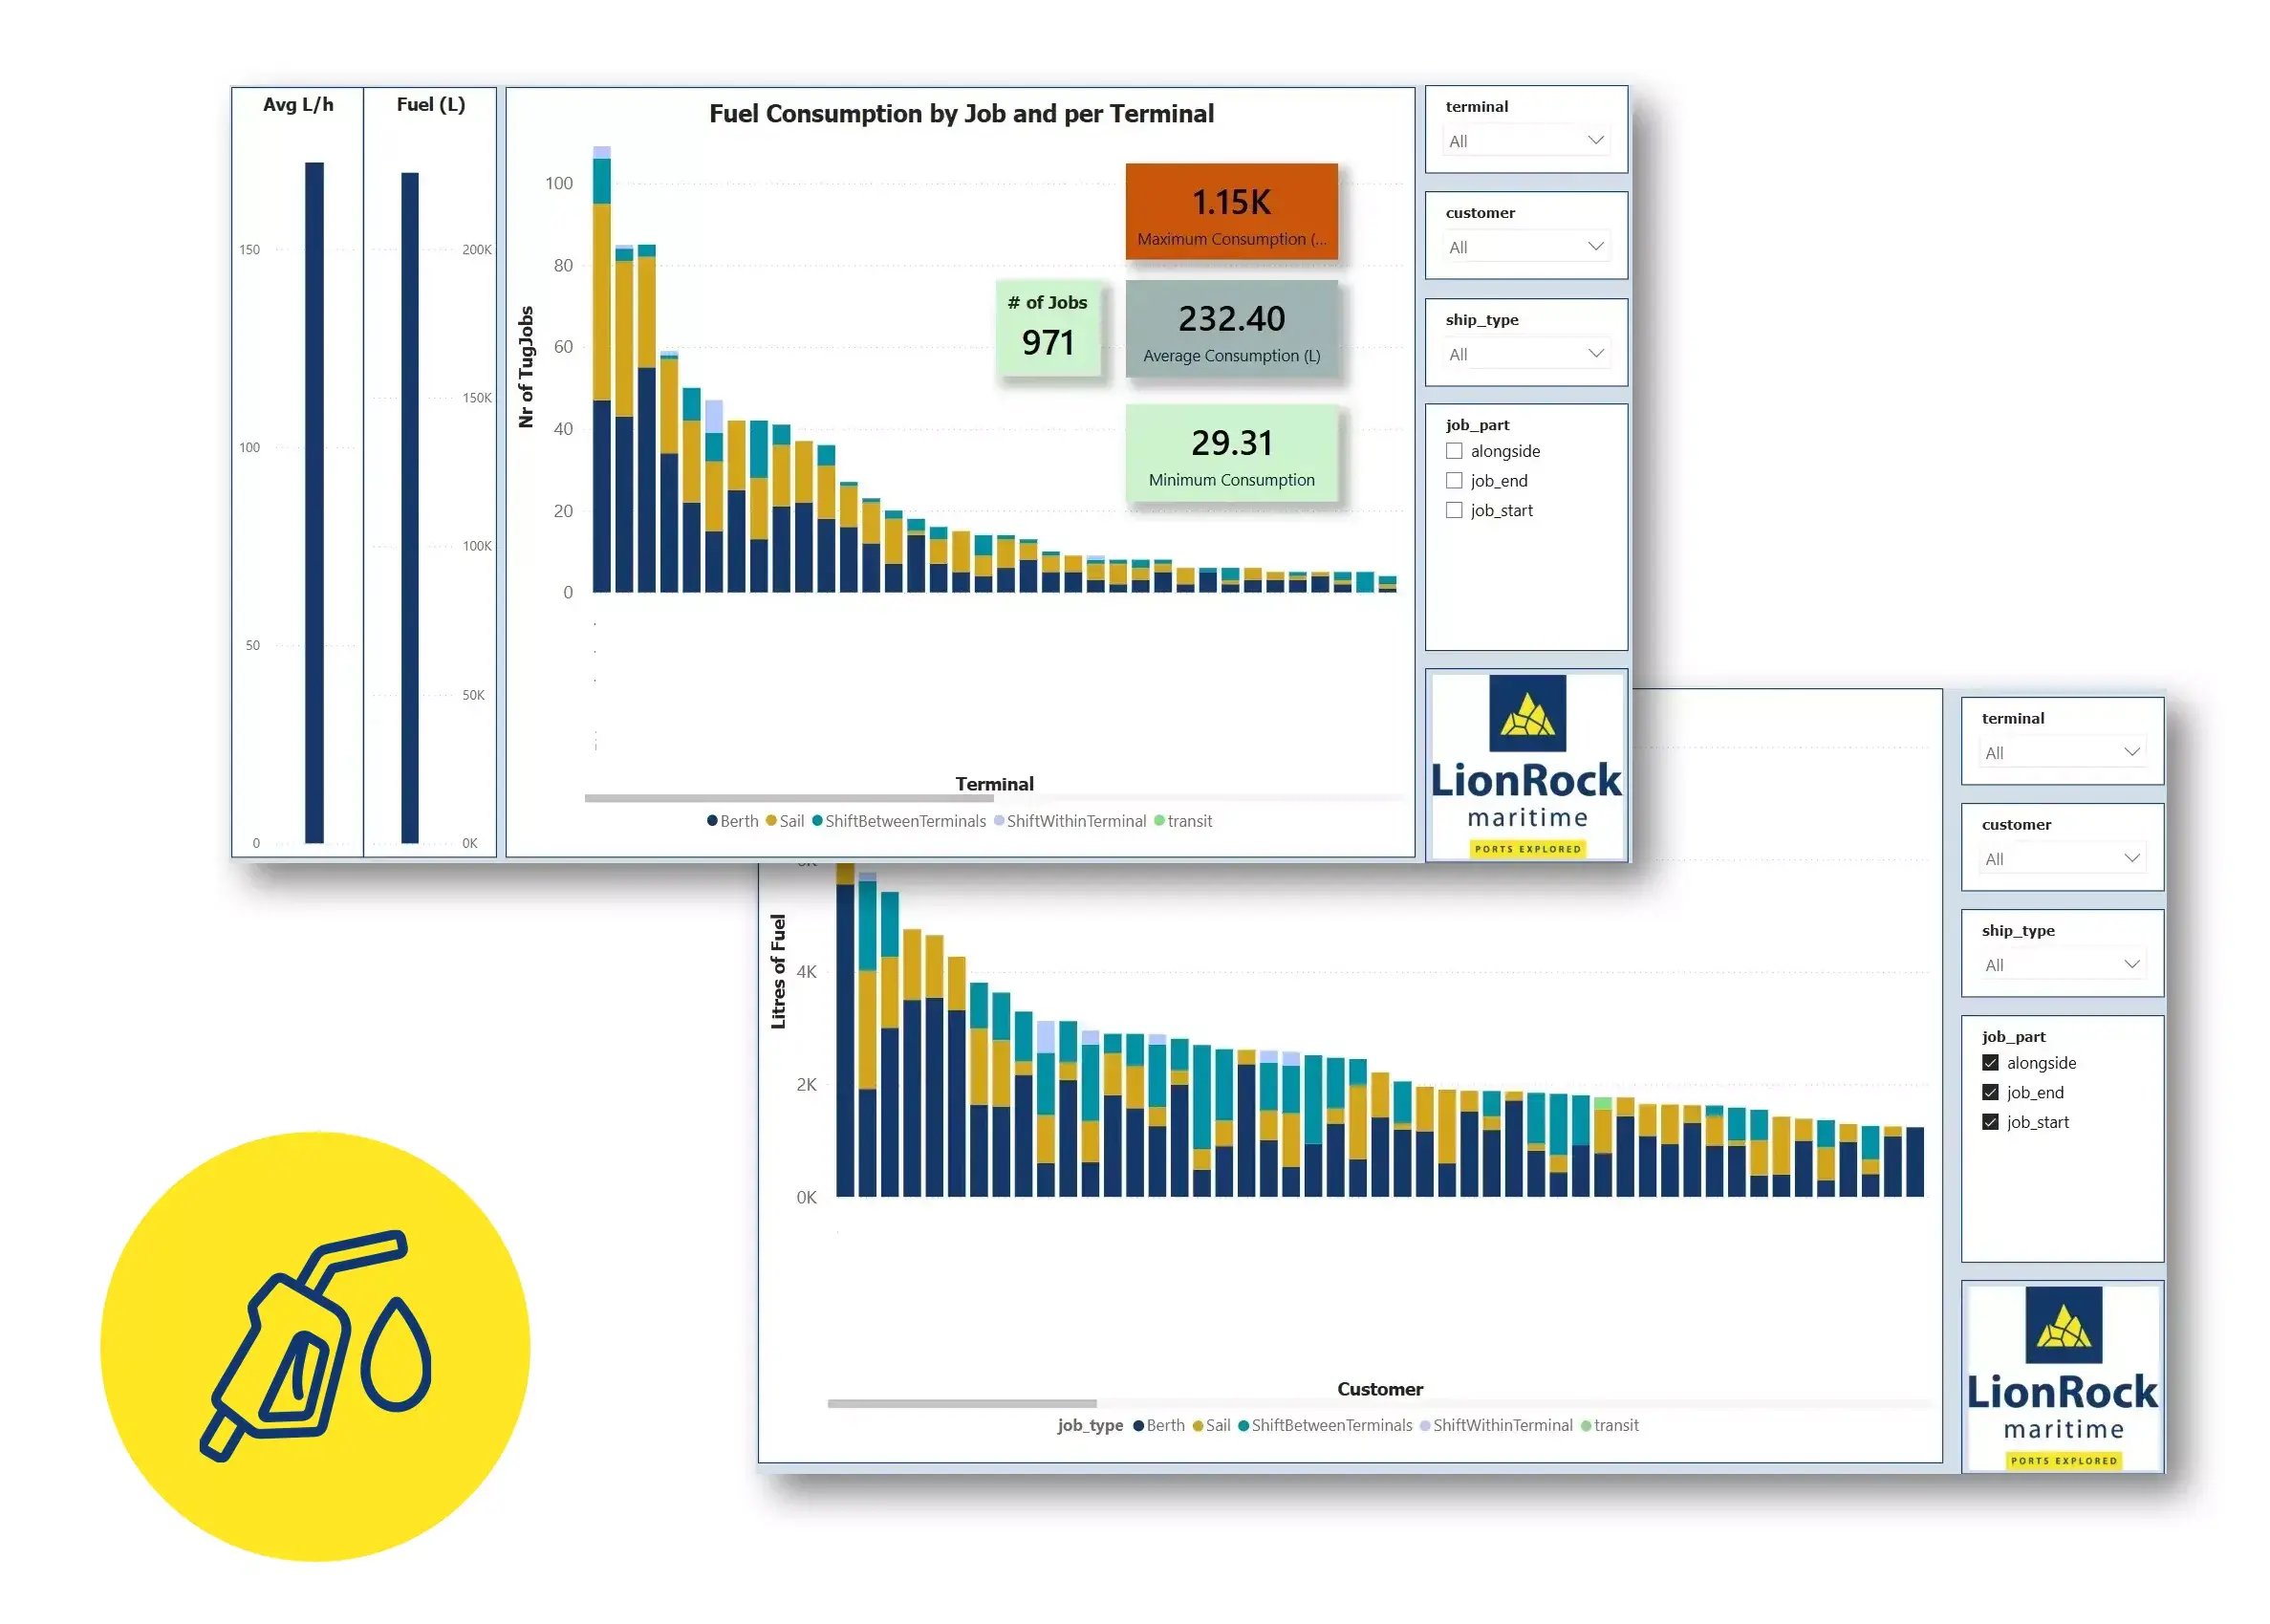
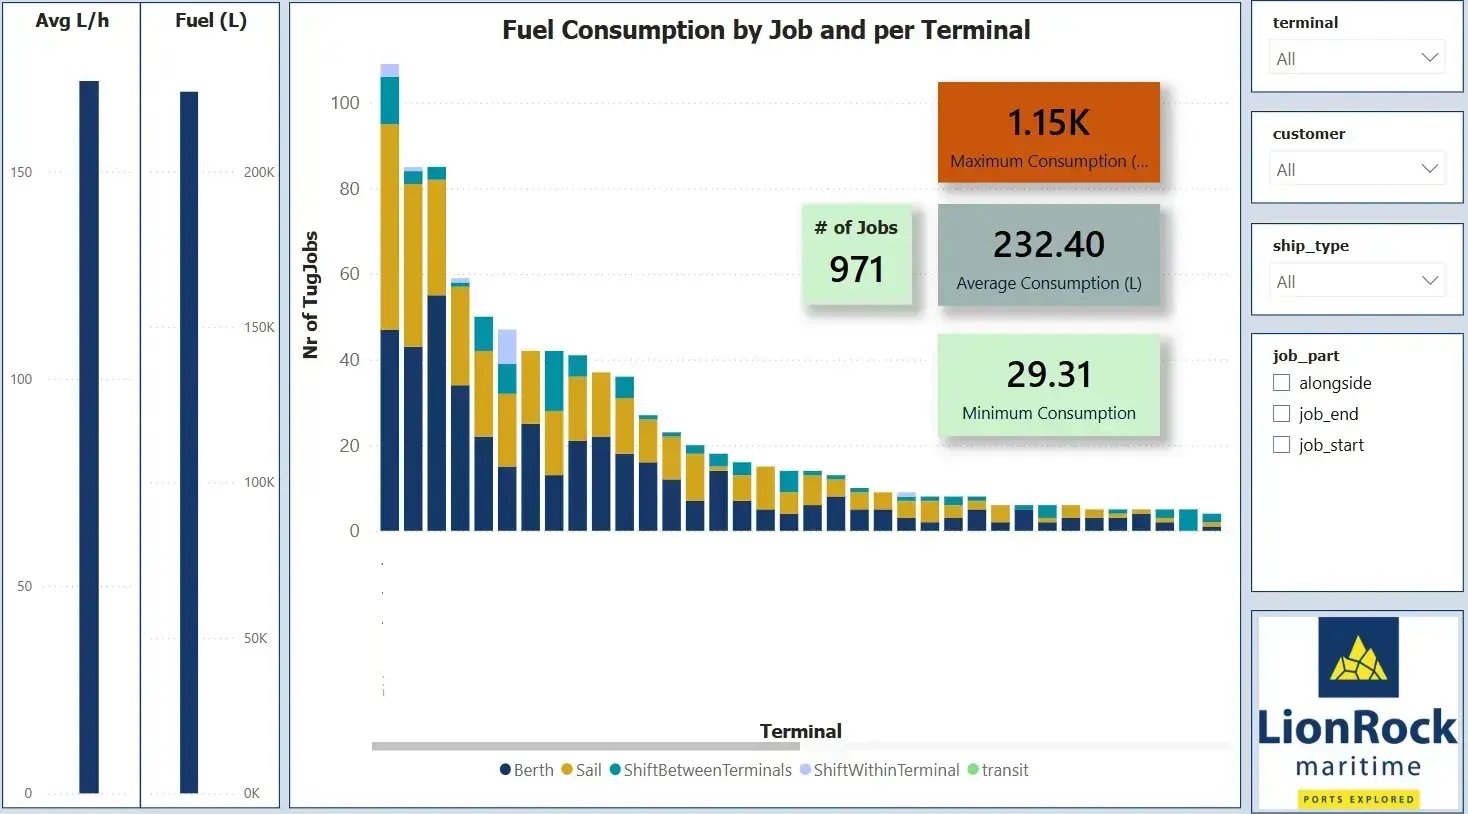
This dashboard offers a comprehensive breakdown of fuel consumption across different terminals, visualizing the distribution of litres of fuel used per tug job. The stacked bar chart categorizes fuel usage by job type (berth, sail, shift between terminals, shift within terminal, and transit), providing a clear comparison of operational demands across terminals.

Key metrics are also highlighted:

The minimum, average and maximum fuel consumption per job 

Job activity levels by terminal and total fuel consumption.

For port authorities and planners, these insights are crucial for identifying terminals with the highest operational demands and fuel footprints, evaluating the impact of terminal-specific activity, and guiding decisions around fleet deployment, fuel cost management, and environmental sustainability.

Included Reports

Insights we provide:

  • Fuel cost by customer
  • Fuel cost by terminal