Reports: PowerCaptain
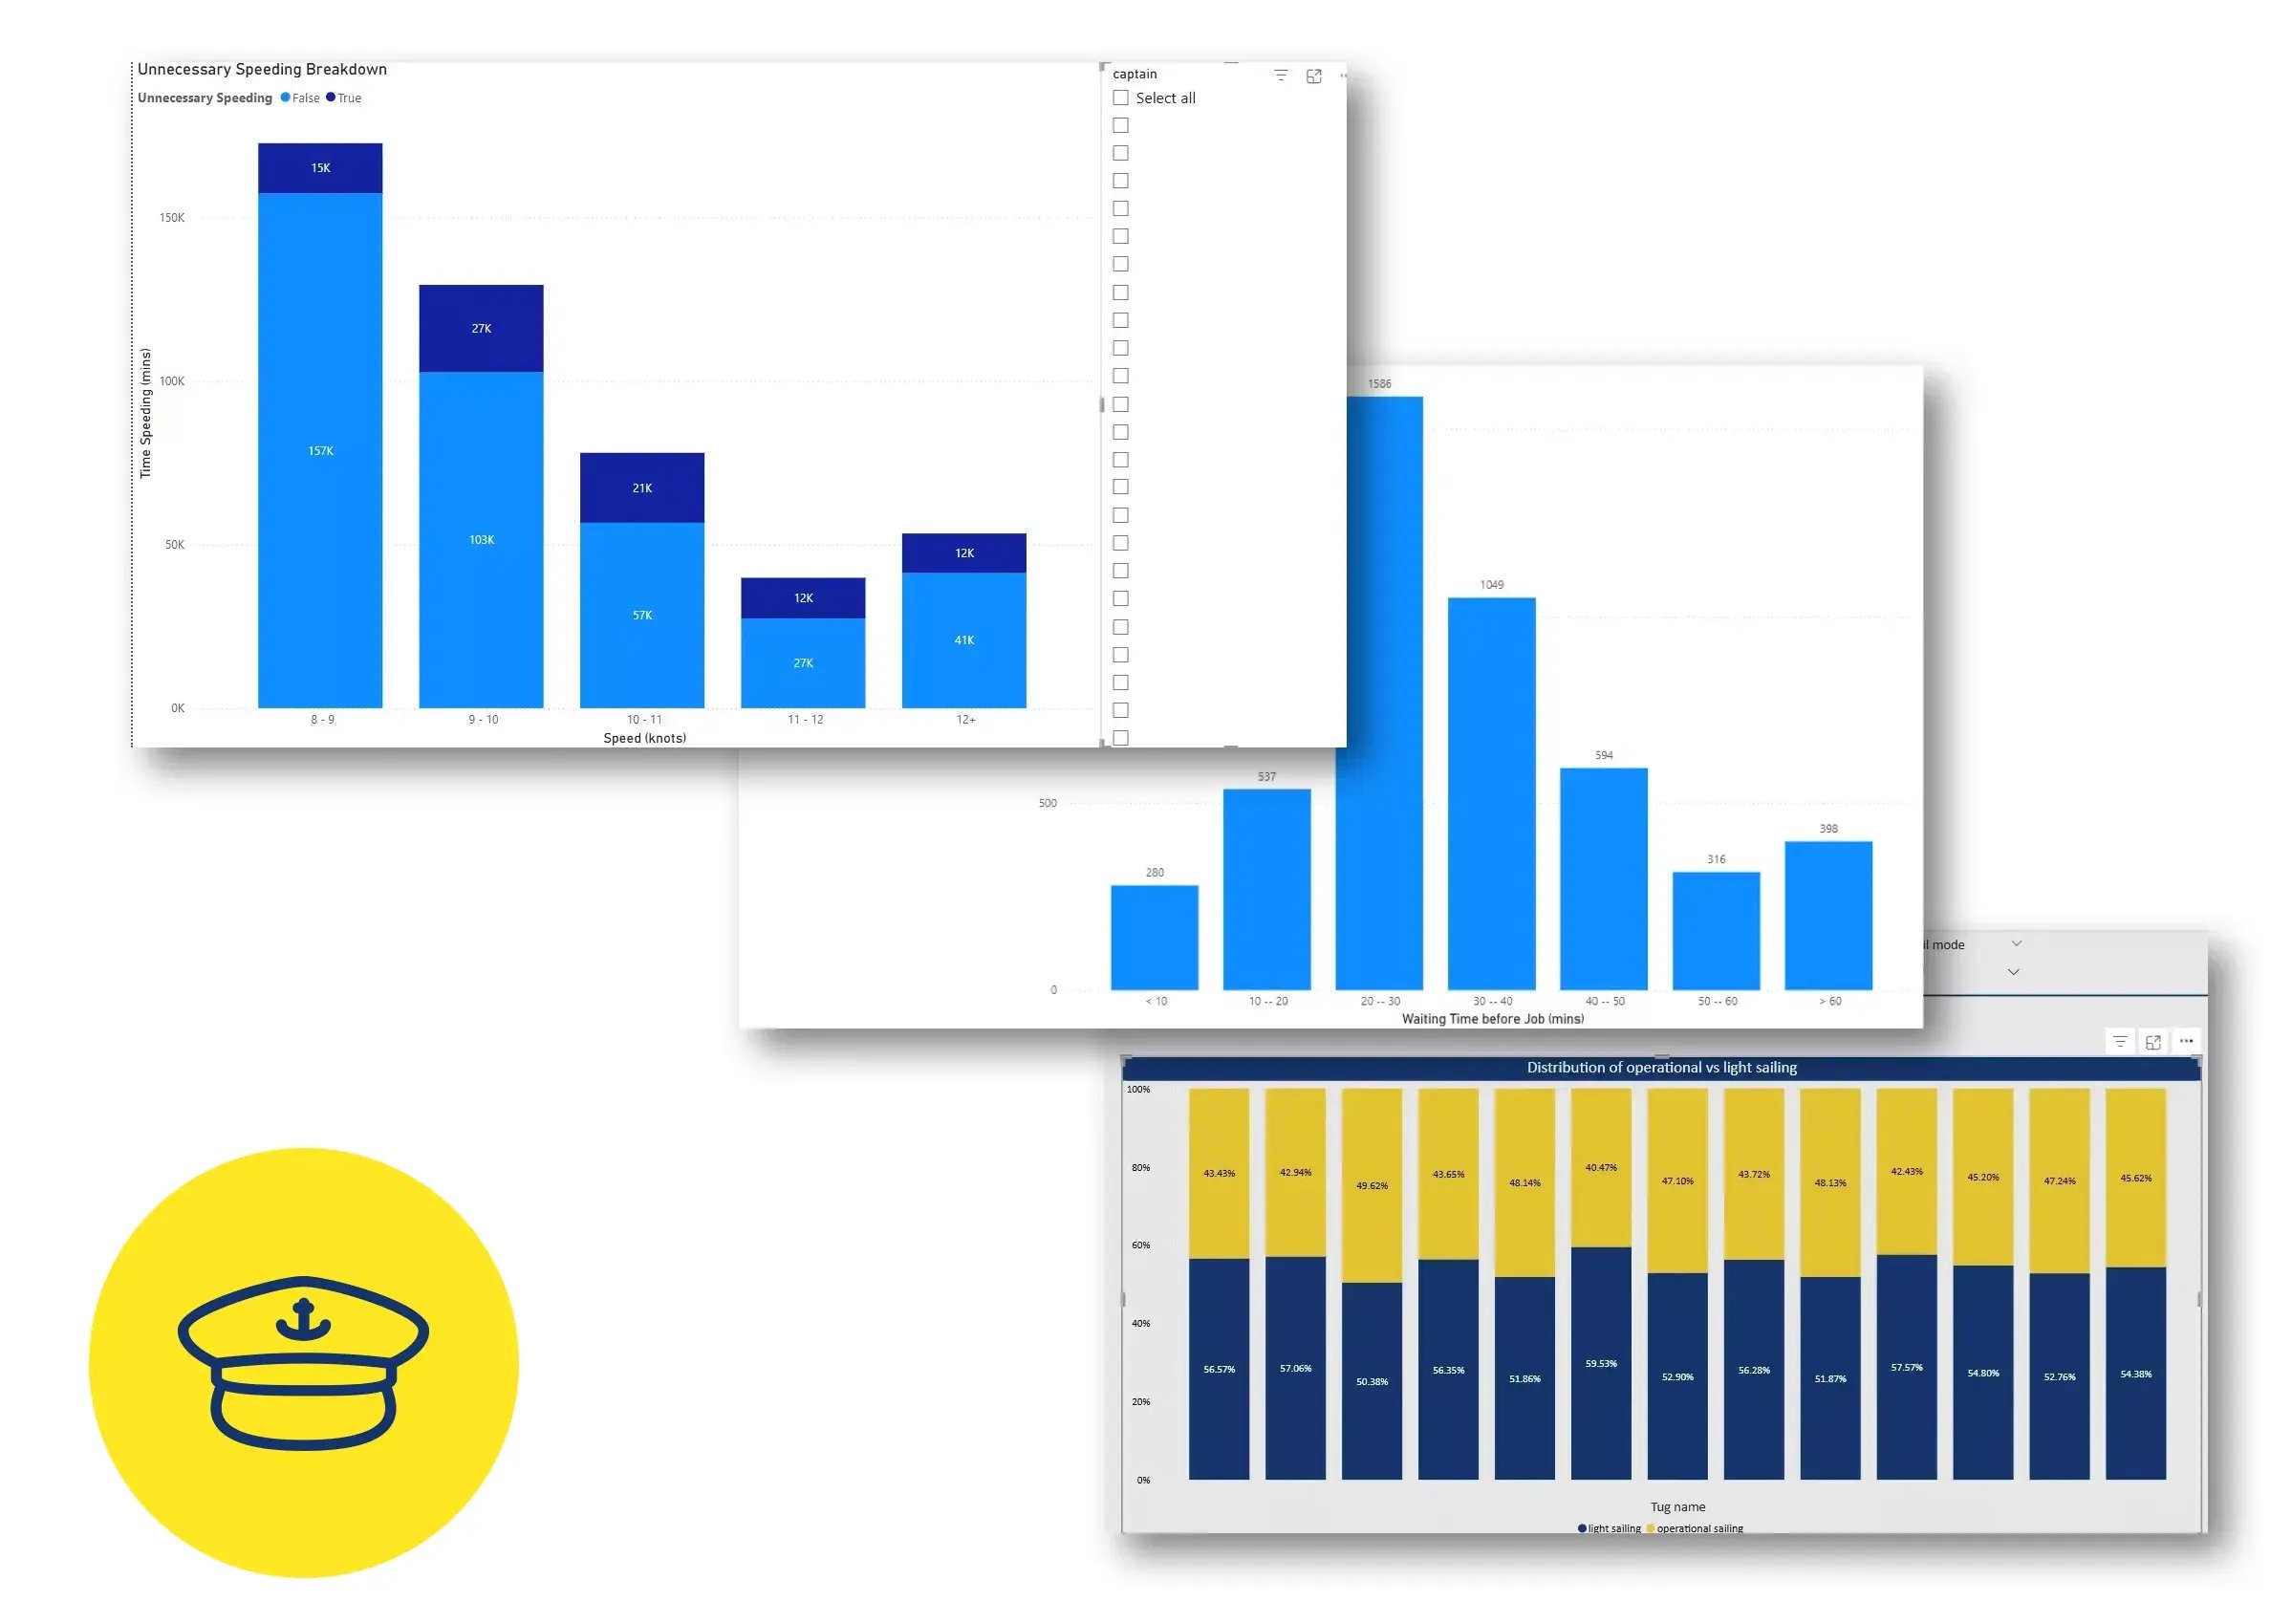
Fuel Waste Monitoring Dashboard
Turning Operational Inefficiencies into Fuel and Emissions Savings
Tugboat operations are often affected by subtle inefficiencies—excessive lightsailing speeds, prolonged idling, and unnecessary mileage—all of which silently drive up fuel costs and emissions. The Fuel Waste Monitoring Dashboard, powered by PowerCaptain, provides both fleet-wide and vessel-specific visibility into these hidden fuel waste drivers. It quantifies operational patterns such as over-speeding during non-tow transits, waiting time at idle, and redundant mileage logged without productive outcomes.
By visualizing these inefficiencies over time and comparing against optimized baselines, the dashboard empowers managers to identify high-impact savings opportunities. Whether it's reducing idle time at berth, optimizing harbor routes, or enforcing eco-speed protocols during lightsailing, this tool enables data-backed decisions that enhance efficiency and support sustainability targets. With transparent metrics and color-coded analytics, the Fuel Waste Monitoring Dashboard is a critical tool for any tugboat operator seeking to cut costs while improving environmental performance across port operations.