Market Traking Dashboard - PortExplorer - LionRock Maritime Resource

Reports: PortExplorer

Market Tracking Dashboard

Towage Market Intelligence for Smarter Market Positioning and Strategic Planning


Port dynamics are constantly evolving—shaped by shifting operator activity, fleet deployment strategies, and fluctuations in vessel traffic. The Market Tracking Dashboard offers a centralized view of towage market behavior across terminals, ship types, and operators. It brings together critical operational data—such as tug utilization, ship assist volumes, and market share by port segment—into one powerful tool for situational awareness and competitive benchmarking.

With intuitive visualizations, the dashboard helps decision-makers monitor ship assist trends, assess tug allocation efficiency, and evaluate commercial performance across time and geography. 

LionRock Crane Icon
+

Ports Explored

LionRock fuel Icon
€   +

Worldwide Annual Cost Savings

LionRock co2 icon
KG   +

KGs of CO2 saved

Report overview

How the Market Tracking Dashboard can help your business

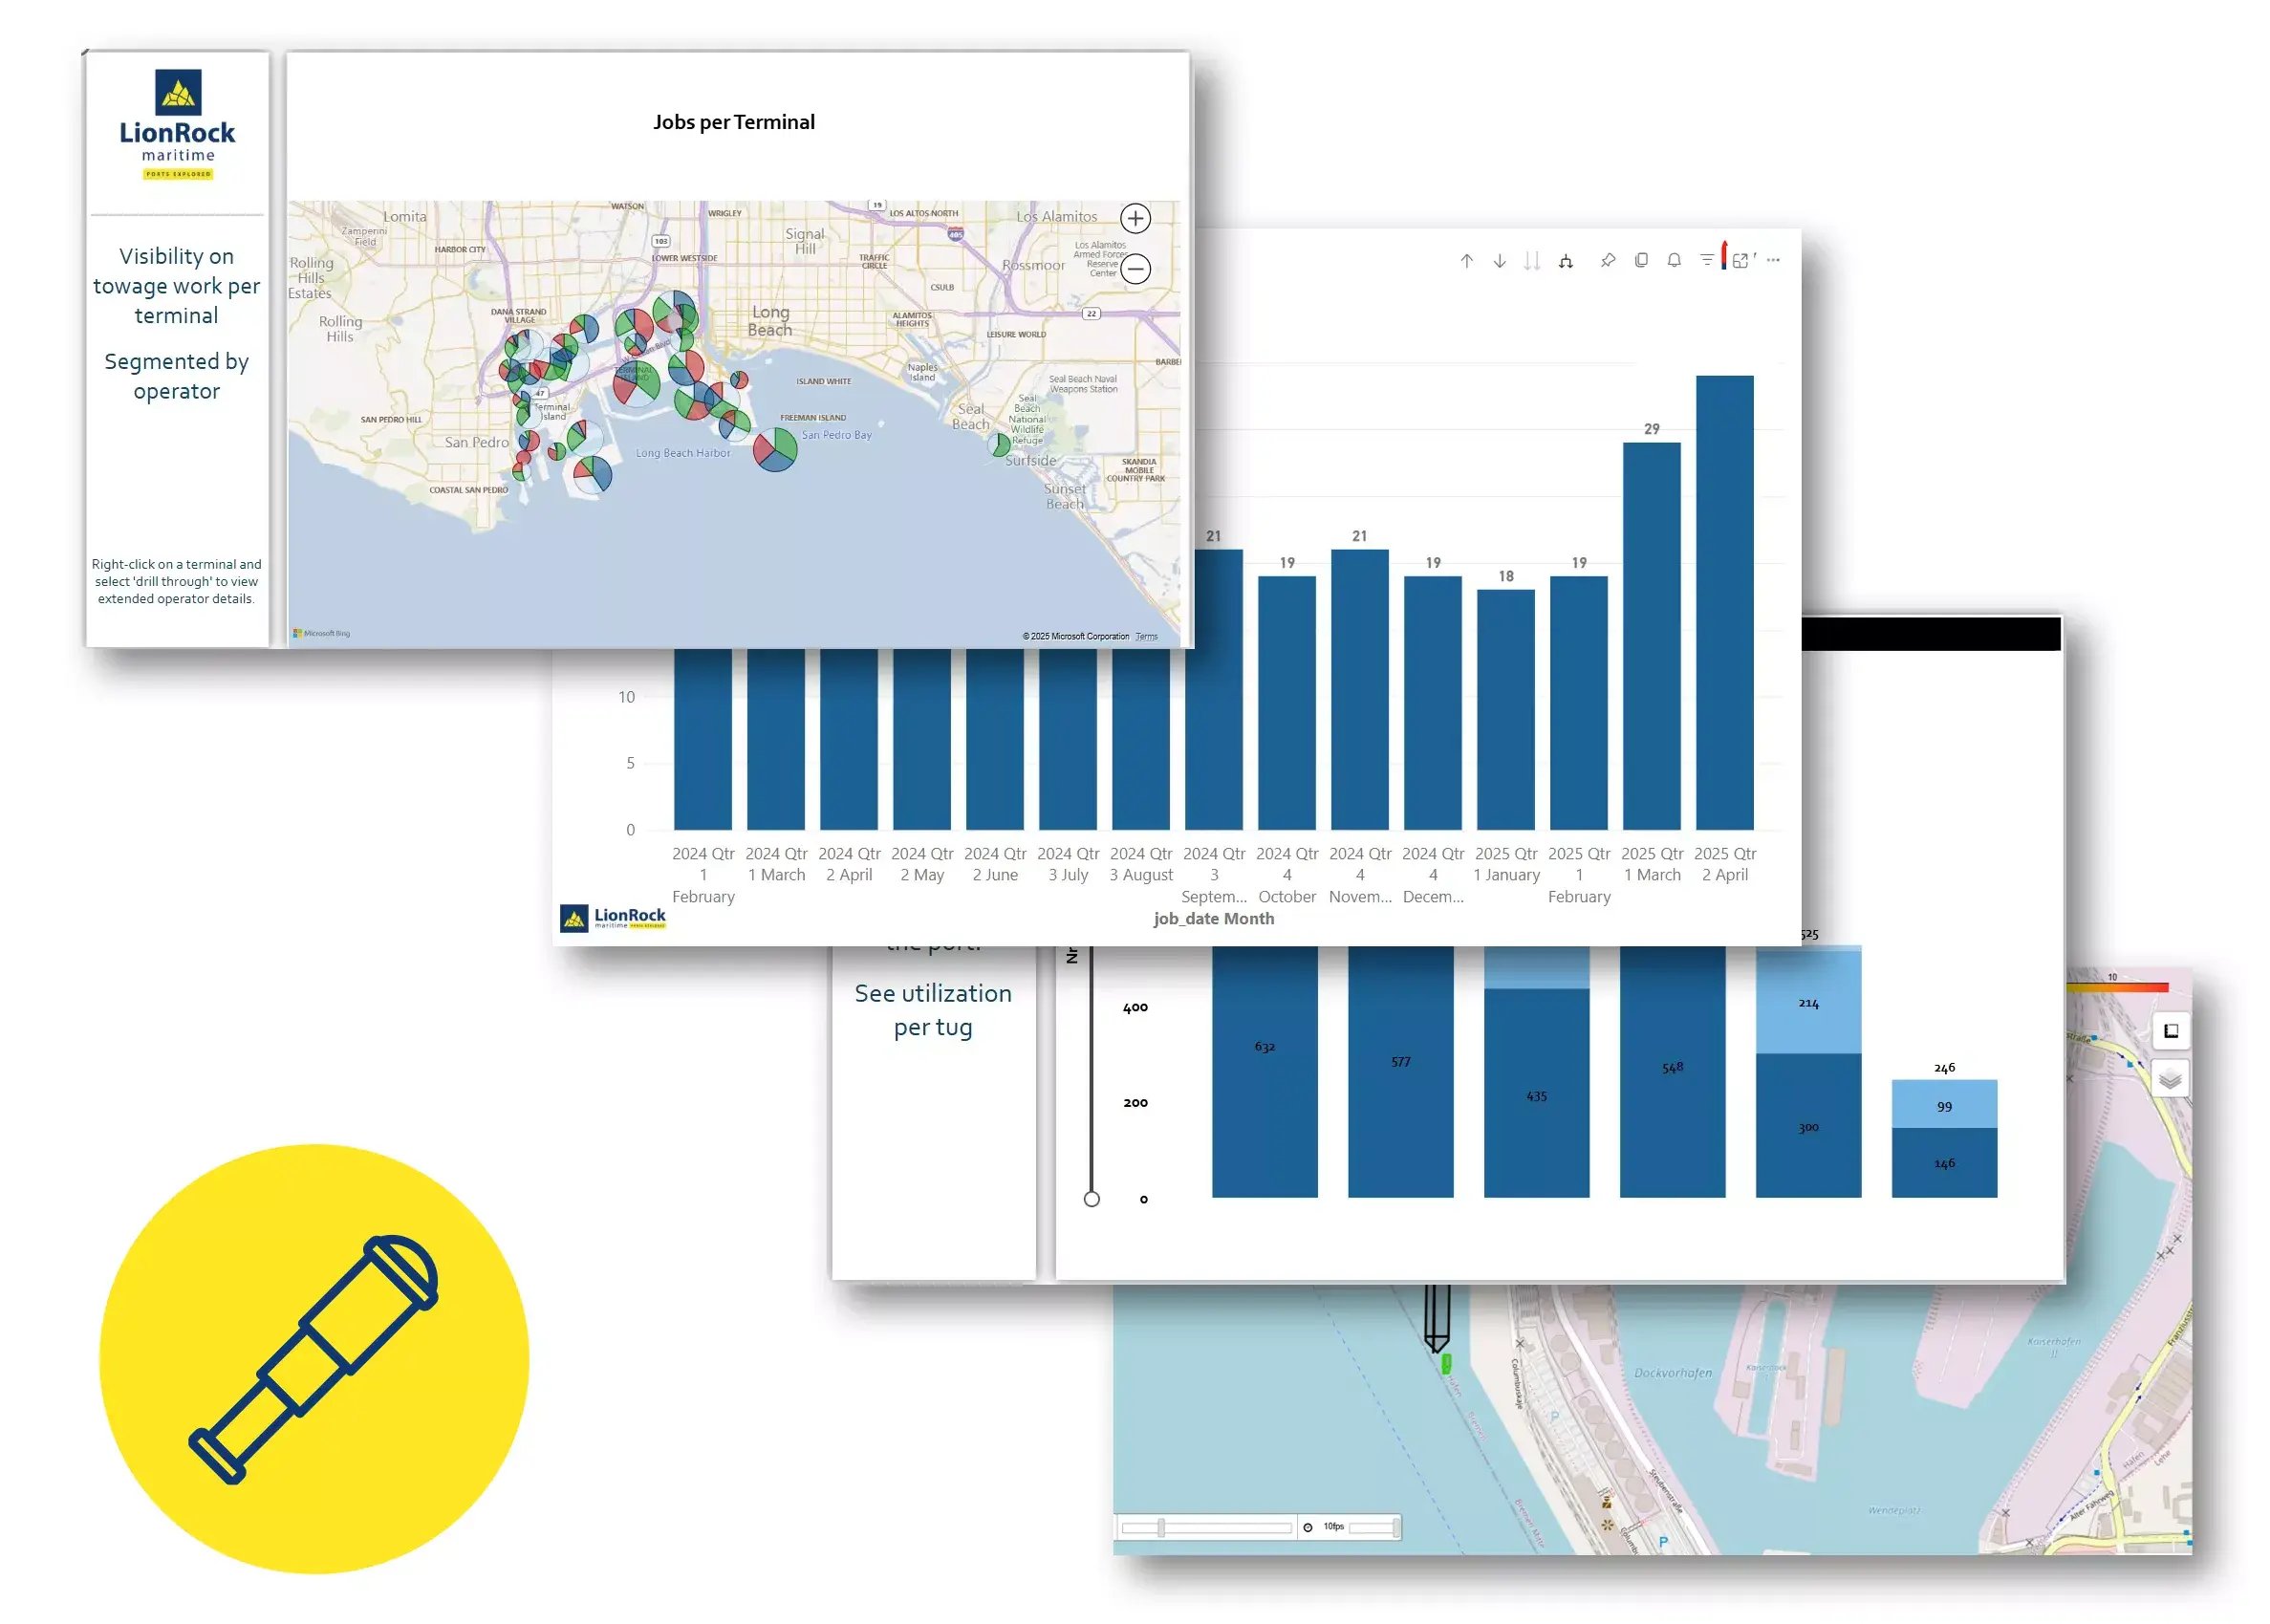
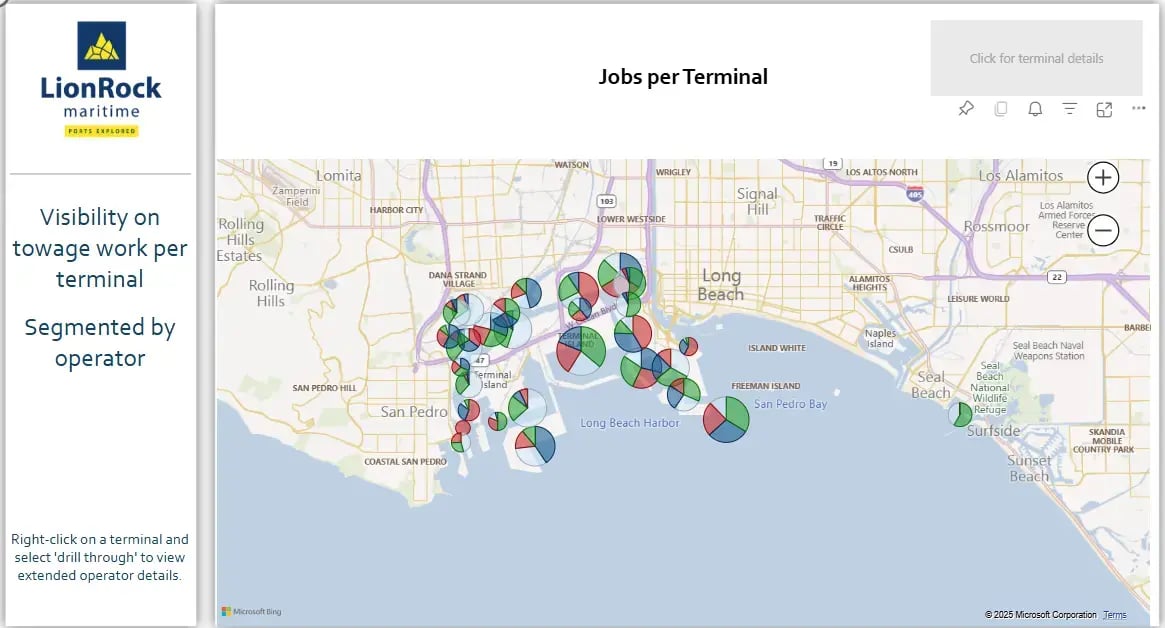
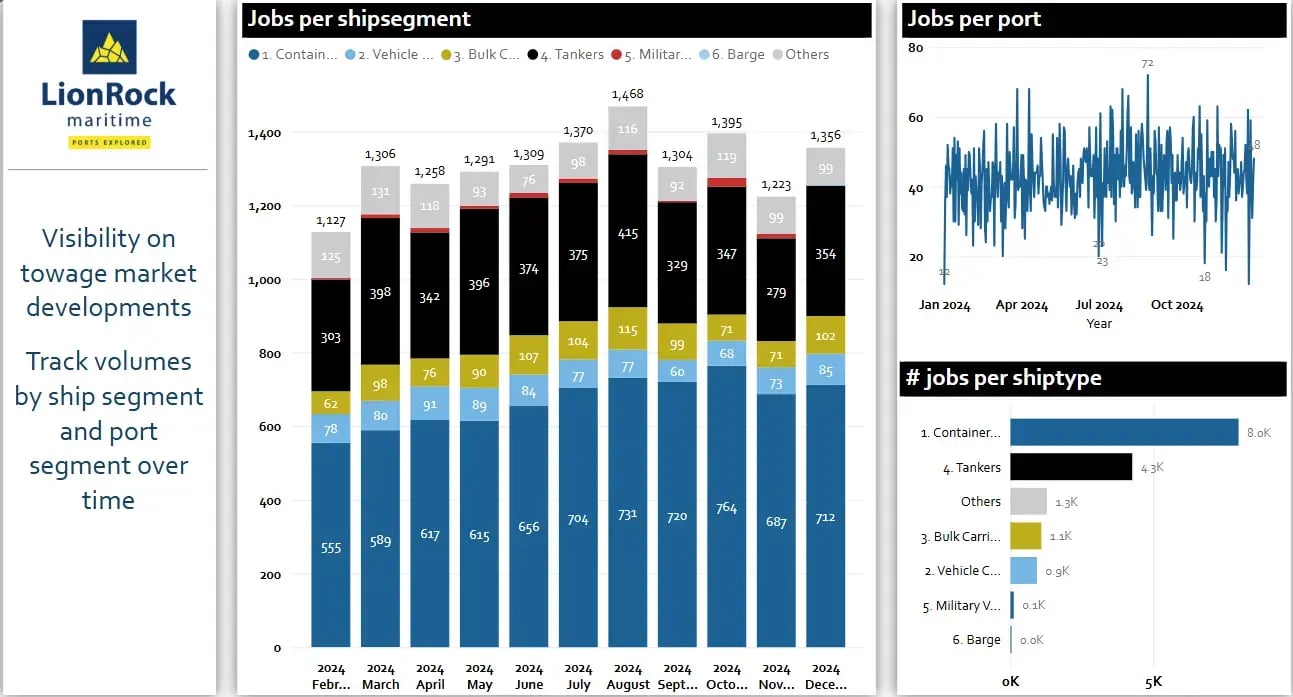
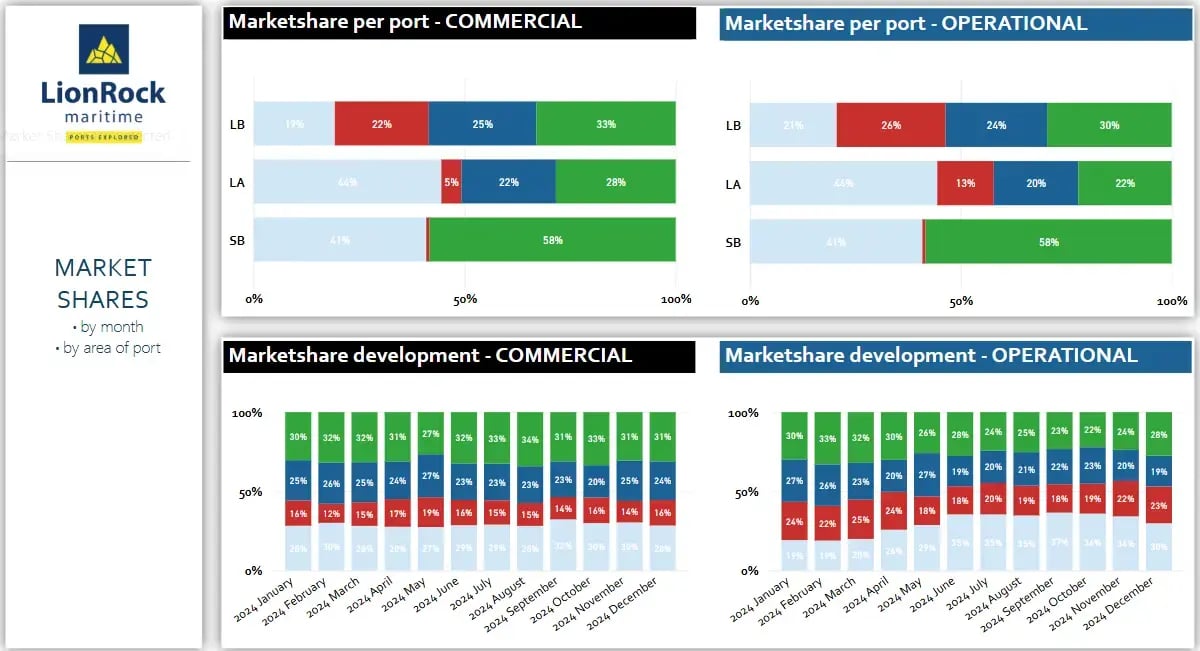
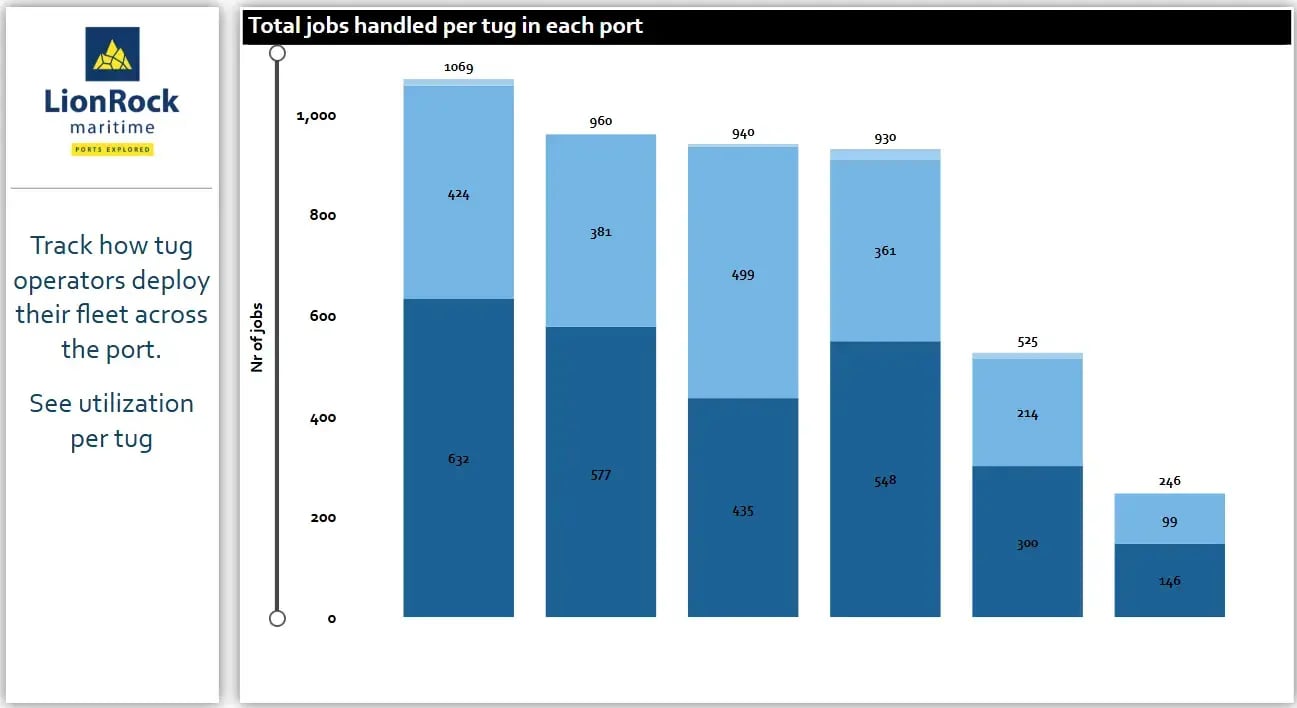
This report presents an example analysis using LionRock Maritime’s Market Tracking Dashboard, powered by PortExplorer, to demonstrate how market share, fleet utilization, and assist demand can be continuously monitored and optimized across port operations. The dashboard captures data from tug job volumes, operator deployment patterns, and ship assist activity segmented by terminal and vessel type.

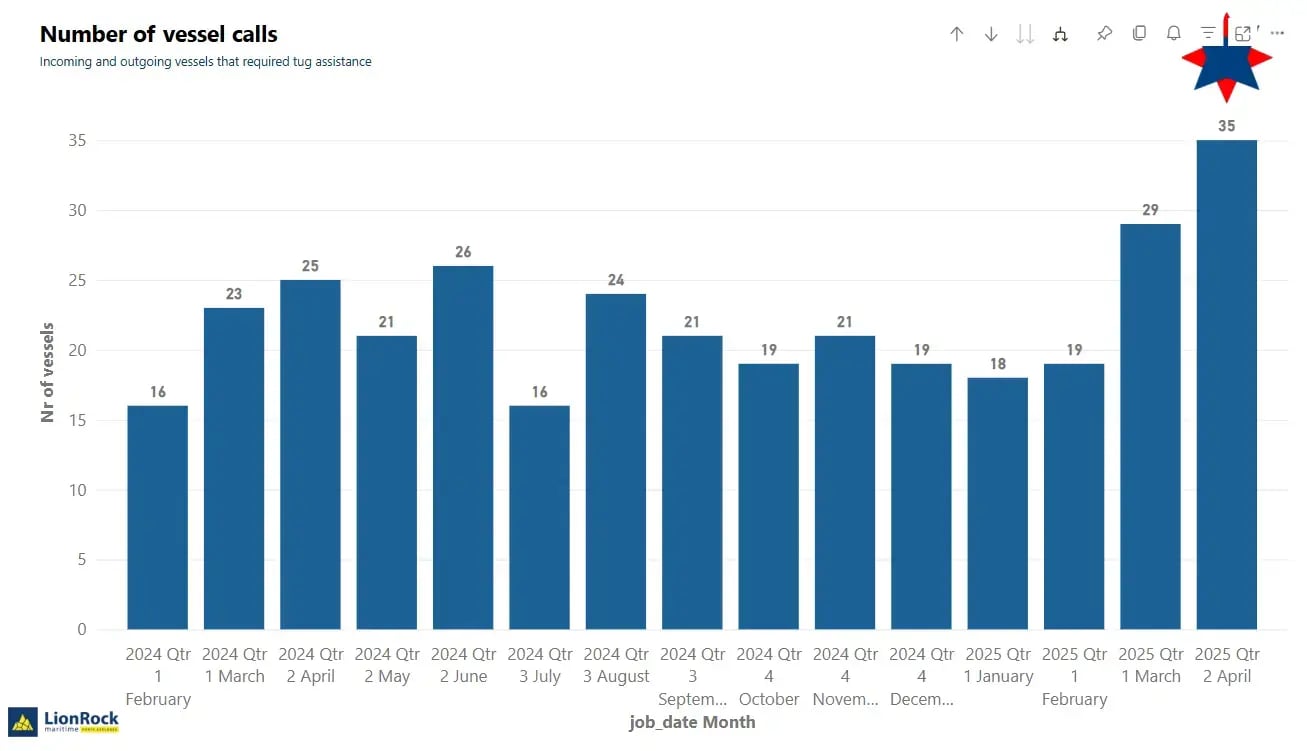
It allows users to evaluate how tug services are distributed geographically, how market presence evolves over time, and how vessel calls correlate with towage demand. With the ability to visualize job allocation per tug, share of work per operator, and assist volumes by ship type, the tool enables both commercial and operational teams to respond proactively to market developments. These insights support smarter decision-making around resource deployment, contract management, and strategic growth—making it an essential asset for competitive, data-driven towage operations.

2.1.1_Ship_assist_volumes_by_Terminal

Insight 1

Ship Assist Volumes by Terminal

This visualization displays the distribution of ship assist jobs across terminals within a port area, segmented by service provider. Each terminal is represented by a pie chart, where the colored segments reflect the share of assist jobs handled by different operators. This offers a clear and intuitive overview of activity concentration and market presence across the port.

By breaking down assist volumes at the terminal level, the dashboard supports operational benchmarking, competitive analysis, and resource allocation planning. Users can quickly identify high-volume terminals, shifts in operator activity, or underutilized areas—enabling more informed decisions related to service deployment, contracting strategy, and future growth opportunities within port towage operations.

2.1.2_Ship_assist_volumes_development_over_time

Insight 2

Ship Assist Volumes Development Over Time

This dashboard provides a comprehensive view of ship assist activity over time, segmented by ship type. Each monthly column visualizes the number of assist jobs performed for different vessel categories—such as container ships, tankers, bulk carriers, and others—enabling operators to monitor fluctuations in demand across the towage market.

By breaking down volumes at this level, stakeholders gain valuable insights into seasonal trends, cargo segment growth, and operational pressures within each ship type. With the ability to compare job counts across both time and category, this view supports data-driven planning, contract forecasting, and long-term strategic positioning within the port ecosystem.

2.1.3_Ship_assist_market_share_development_by_tug_operator

Insight 3

Ship Assist Market Share Development by Tug Operator

This dashboard tracks how ship assist market share evolves over time across different areas of the port, segmented by tug operator. Market share is presented both on a monthly timeline and across commercial and operational zones, providing a dual perspective on competitive presence and service delivery patterns.

2.1.4_Tug_operator_fleet_utilization_overview

Insight 4

Tug Operator Fleet Utilisation Overview

This chart illustrates the total number of ship assist jobs handled by each tug operator’s fleet, segmented by port. Each bar represents a cumulative job count per port, with individual contributions split by vessel groups or operators, providing a clear comparison of how work is distributed across the fleet.

The dashboard enables users to assess how intensively tug assets are being deployed, revealing patterns of high and low utilization. This level of visibility is essential for managing operational efficiency, minimizing downtime, and aligning fleet capacity with real-time port activity.

2.1.5_Vessel_call_and_tugjob_statistics

Insight 5

Vessel Call and Tug Job Statistics

This chart illustrates the monthly number of vessel calls that required tug assistance, providing a direct measure of towage demand at the port. Each bar represents a count of assisted arrivals and departures, allowing stakeholders to track fluctuations in traffic volume over time.

The visualization helps identify seasonal surges, market shifts, or external factors influencing assist activity—from operational slowdowns to cargo throughput peaks. 

By maintaining visibility on assist-linked vessel traffic, this dashboard enables both tug operators and port planners to anticipate service needs, allocate resources efficiently, and align operational capacity with real-time port dynamics.

2.1.6_Job_playbacks

Insight 6

Job Playbacks

This playback visualization captures the movement of a tug and vessel during a harbor maneuver, providing a detailed reconstruction of the operation. Each tug's path, speed (measured in knots), and interaction with the assisted vessel are tracked on a geographic map, enabling port managers, captains, and safety teams to review the job with full spatial and temporal context.

By replaying actual movements frame by frame, stakeholders can evaluate maneuver timing, tug positioning, and response accuracy—key factors for optimizing safety, training, and coordination. The playback tool also helps identify procedural deviations, highlight best practices, and facilitate debriefings or audits after high-risk or complex jobs.

These visual insights turn every past operation into a learning opportunity, strengthening crew performance, improving planning precision, and reinforcing accountability in daily tug operations.

Included Reports

Insights we provide:

  • Ship Assist Volumes by Terminal
  • Ship Assist Volumes Development Over Time
  • Ship Assist Market Share Development by Tug Operator
  • Tug Operator Fleet Utilisation Overview
  • Vessel Call and Tug Job Statistics
  • Job Playbacks