Tug Capacity Tool- PortExplorer and PortCaptain - LionRock Maritime Resource

Reports: PortExplorer / PortCaptain

Tug Capacity Tool

Rightsize your fleet and optimize your business portfolio for fleet utilization


Port operations are dynamic—tug demand is variable based on terminal activity, or changing customer footprints. The Tug Capacity Tool offers critical visibility into how tugs are utilized, across customers,  port zones and operational scenarios. It enables planners and port managers to evaluate peak tug concurrency, model the impact of adding new business, and align capacity planning with real-world demand.

With clear, data-driven visualizations, this dashboard supports optimized fleet deployment and allows you to choose the customers and business that best fits your fleet. The Tug Capacity Tool transforms fragmented tug usage data into actionable capacity intelligence.

LionRock Crane Icon
+

Ports Explored

LionRock fuel Icon
€   +

Worldwide Annual Cost Savings

LionRock co2 icon
KG   +

KGs of CO2 saved

Report overview

How the Tug Capacity Tool can help your business

This report presents an example analysis using LionRock Maritime’s Tug Capacity Tool, powered by PortExplorer and PortCaptain, to demonstrate how tug operators can evaluate business development opportunities and optimize fleet utilization. The dashboard captures metrics on simultaneous tug activity and job distribution across port zones, providing a clear picture of where, when, and how capacity pressure builds.

With insights into peak concurrency, zone-level tug demand, and various other variables, this tool helps identify operational bottlenecks and simulate commercial changes—such as shifts in customer volumes or new terminal developments. These insights allow operators to proactively manage fleet requirements, safeguard service reliability  all while maximizing asset utilization across the port environment.

2.2.1_Peak_capacity_requirements

Insight 1

Peak Capacity Requirements

This dashboard visualizes the number of tugboats operating concurrently across all terminals, offering a direct measure of peak capacity requirements during busy operational windows. The left-hand bar displays the maximum number of tugs used at the same time, while the right-hand scale illustrates how often specific levels of concurrency occur.

This insight helps operators assess the required fleet size with different business scenario's. One can simulate different customer profiles to detect the best fleet set-up.

2.2.2_Commercial_scenario_impact_assessments

Insight 2

Commercial Scenario Impact Assessment

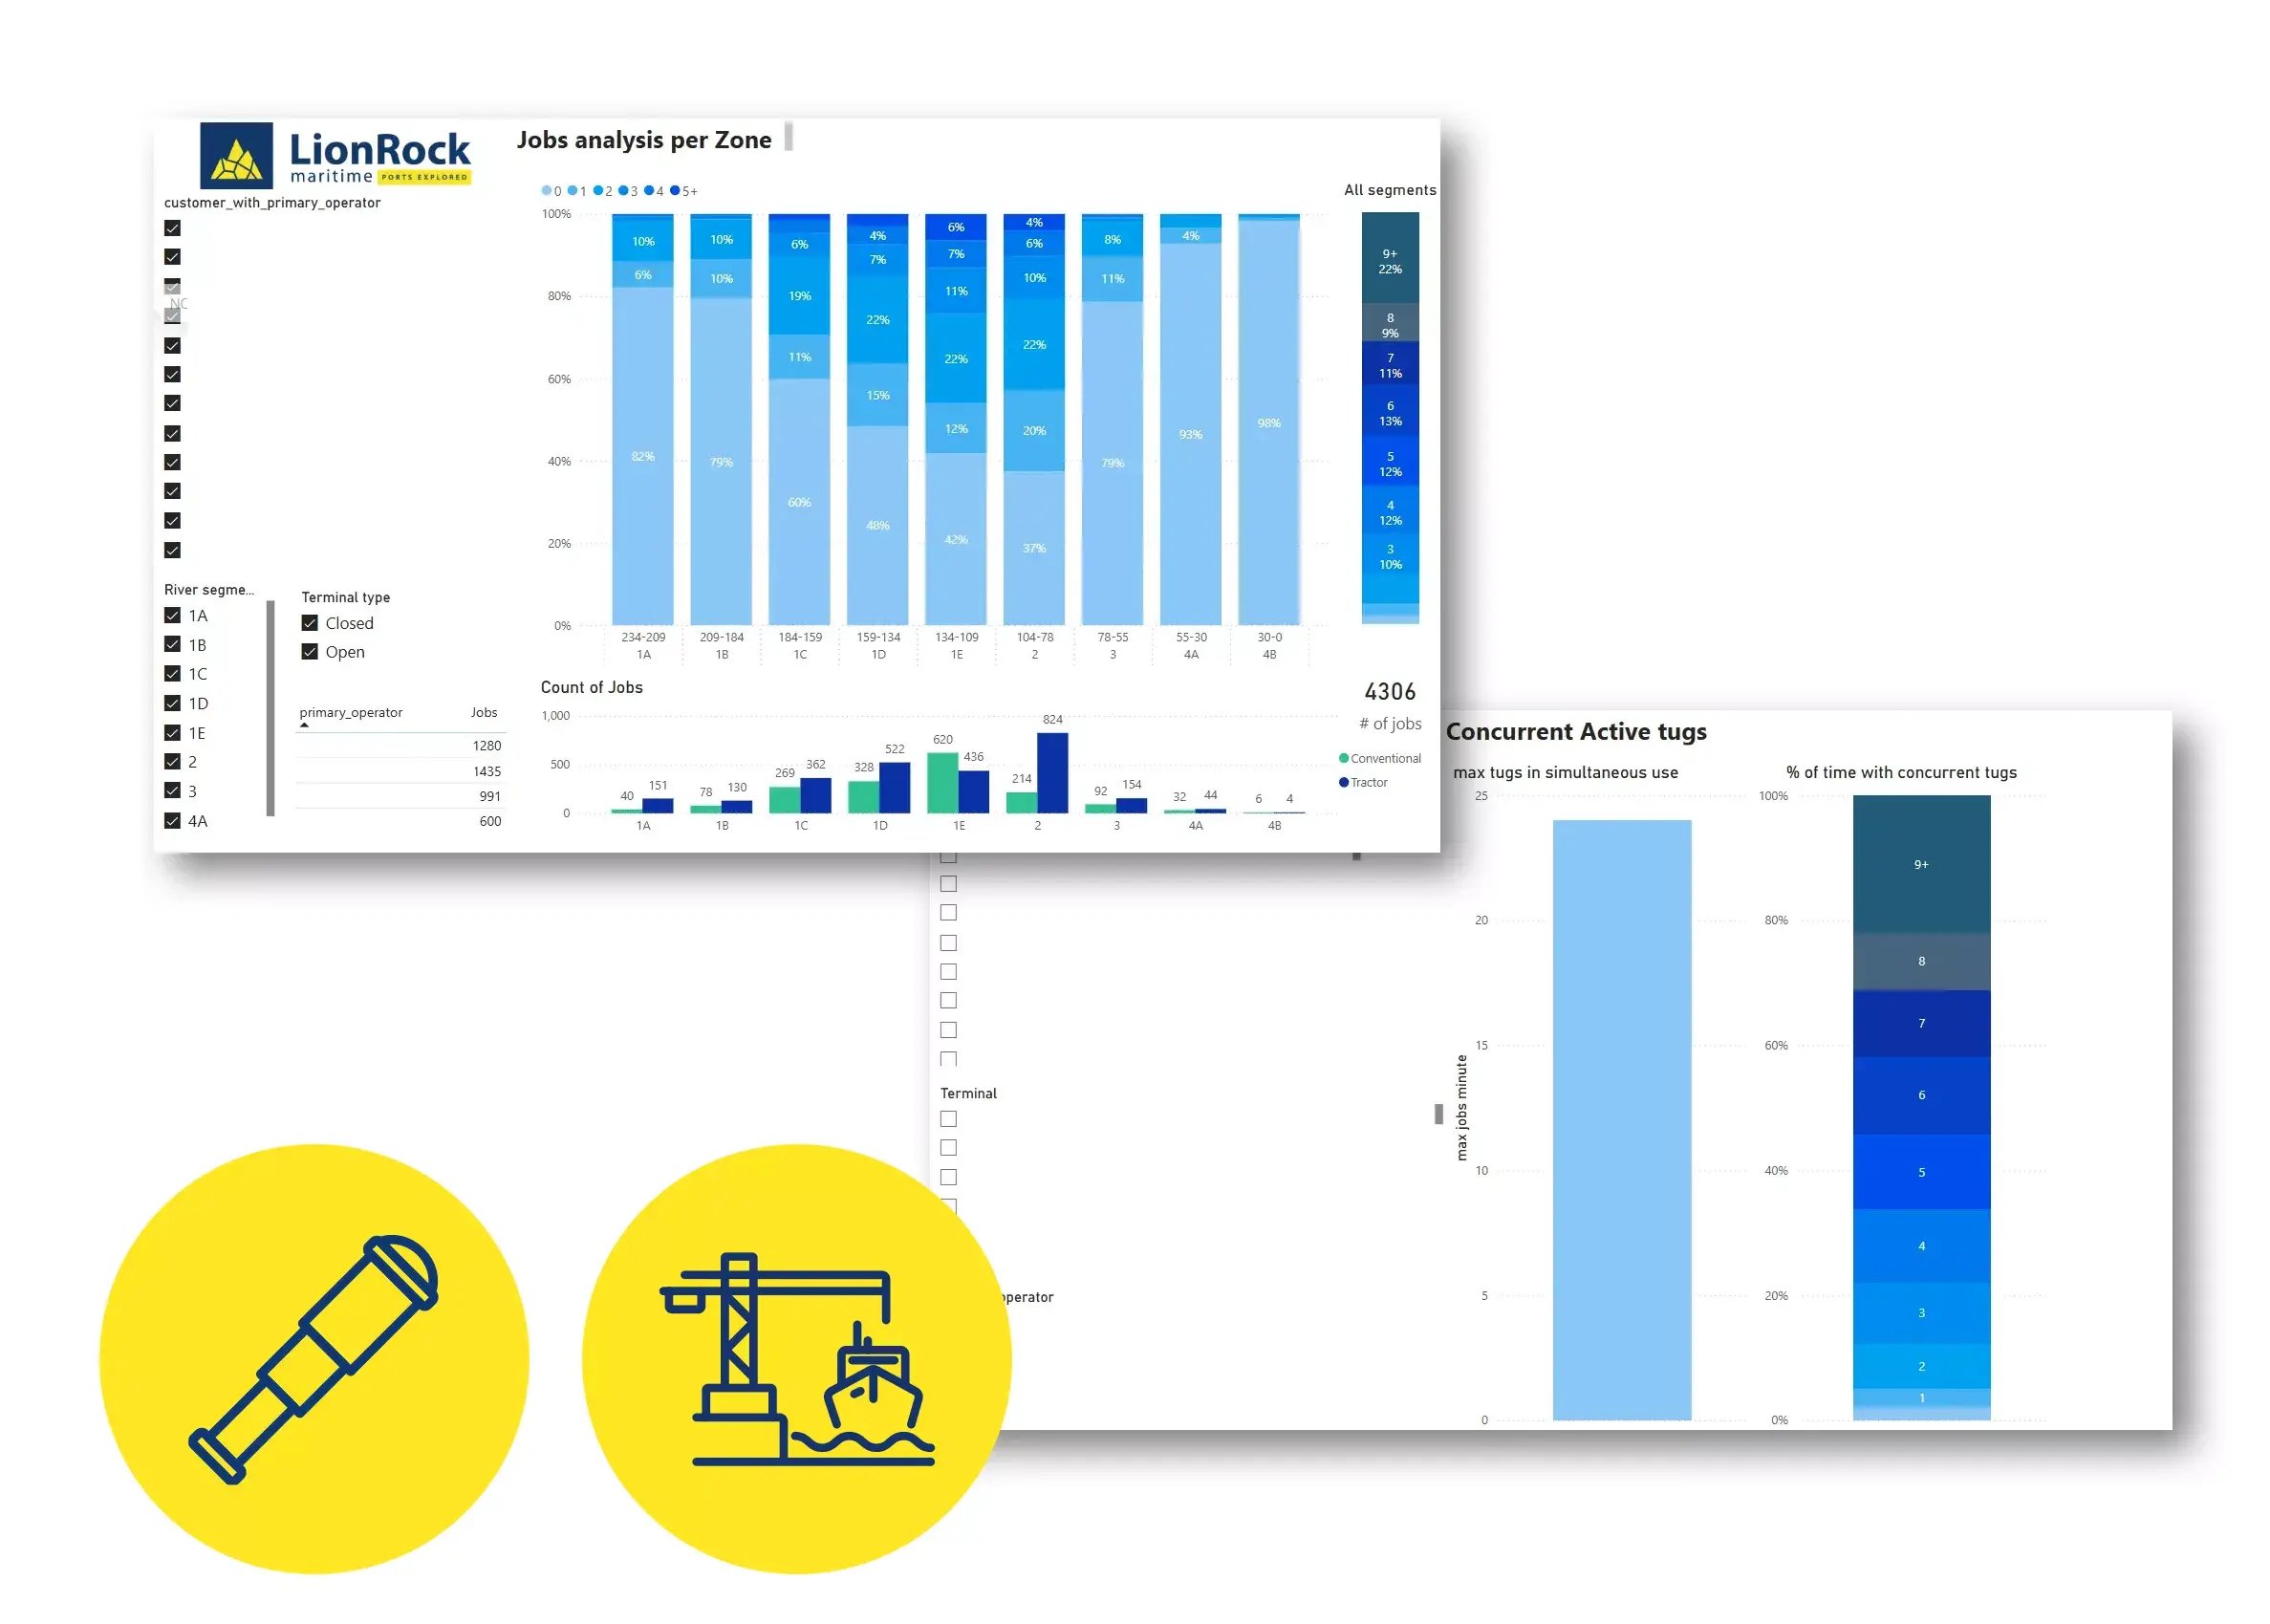
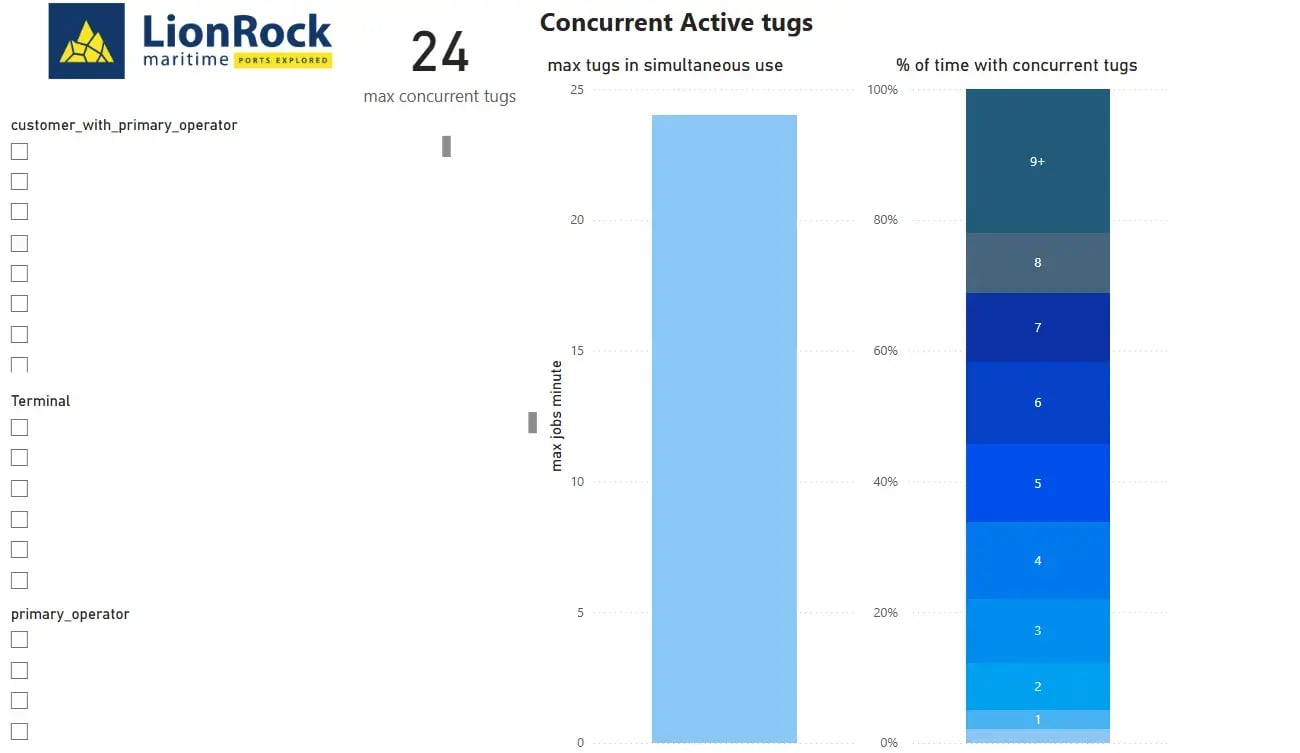
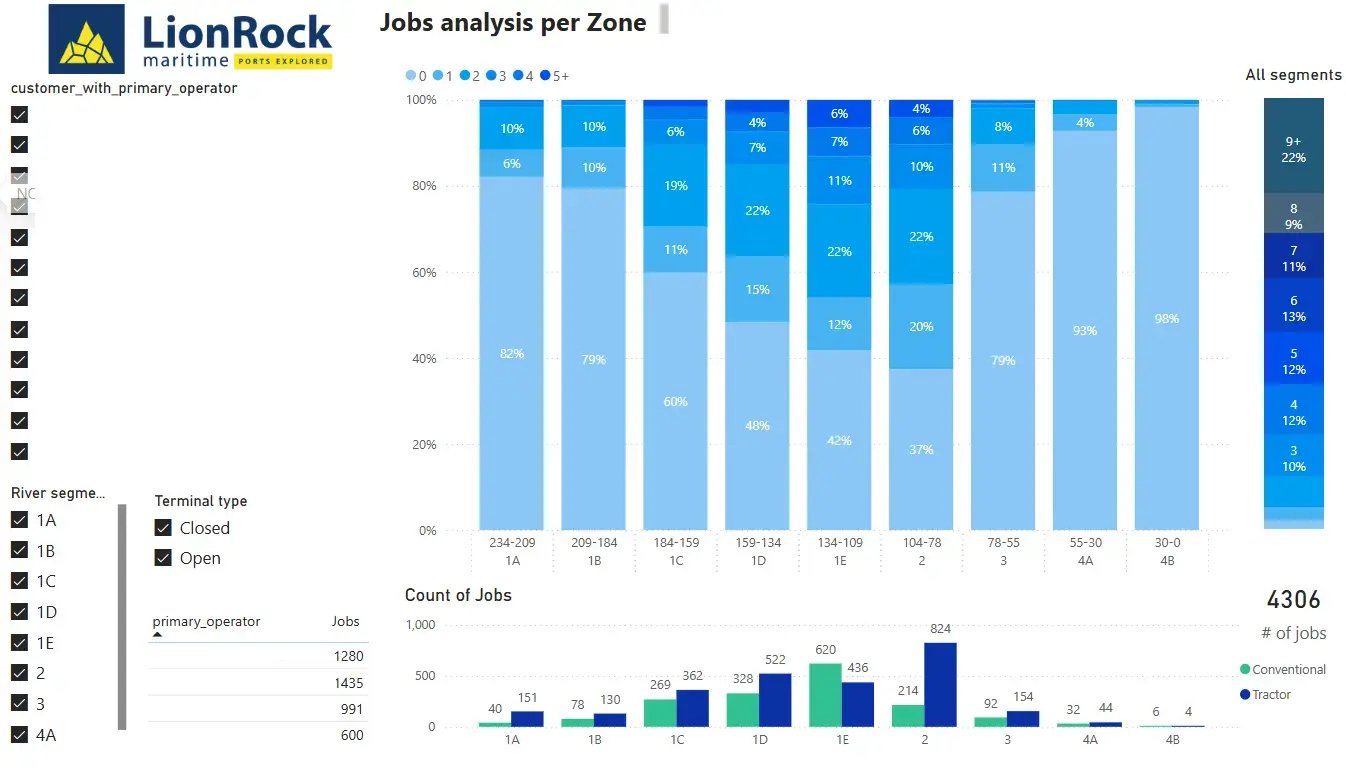
This dashboard offers a detailed breakdown of tug job complexity and frequency across various port zones, helping stakeholders assess how different commercial scenarios—such as terminal openings, customer changes, or vessel mix—affect tug capacity needs. The upper visualization highlights the distribution of tug job intensities, showing the percentage of jobs that require 1, 2, 3, or more tugs concurrently within each river or terminal segment.

By mapping this across both open and closed terminal types, the tool allows operators to evaluate how operational demands shift geographically, and how terminal development or customer strategies might drive increased tug utilization. The bottom panel further segments job volumes by tug type—Conventional vs. Tractor tugs—providing valuable input for fleet composition and asset planning decisions.

This insight enables forward-looking analysis by answering critical planning questions like:
Which zones consistently demand higher tug engagement?
How will new terminal scenarios or customer shifts impact our tug mix or crew requirements?

With this level of granularity, operators can simulate operational changes, validate capacity strategies, and adapt commercial planning based on clear, zone-specific tug behavior.

Included Reports

Insights we provide:

  • Peak Capacity Requirement

  • Commercial Scenario Impact Assessment