Tugboat Fuel Index - FuelExplorer - LionRock Maritime Resource

Reports: FuelExplorer

Tugboat Fuel Index

Turning fuel insights into Cost Savings and Sustainability Gains

Tugboat operations face continuous challenges in balancing operational efficiency with fuel costs and environmental responsibilities. The Tugboat Fuel Index, powered by LionRock Maritime’s FuelExplorer platform, provides a comprehensive and data-driven perspective on tugboat fuel efficiency. By analyzing key factors such as fuel use by tugboat, consumption analytics, model validation of fuel efficiency, and detailed fuel curves, this dashboard empowers operators to make informed decisions about their fleet’s performance. It goes beyond simple monitoring, offering insights that help optimize operations, improve sustainability, and reduce costs.

LionRock Crane Icon
+

Ports Explored

LionRock fuel Icon
€   +

Worldwide Annual Cost Savings

LionRock co2 icon
KG   +

KGs of CO2 saved

Report overview

How the Tugboat Fuel Index can help your business

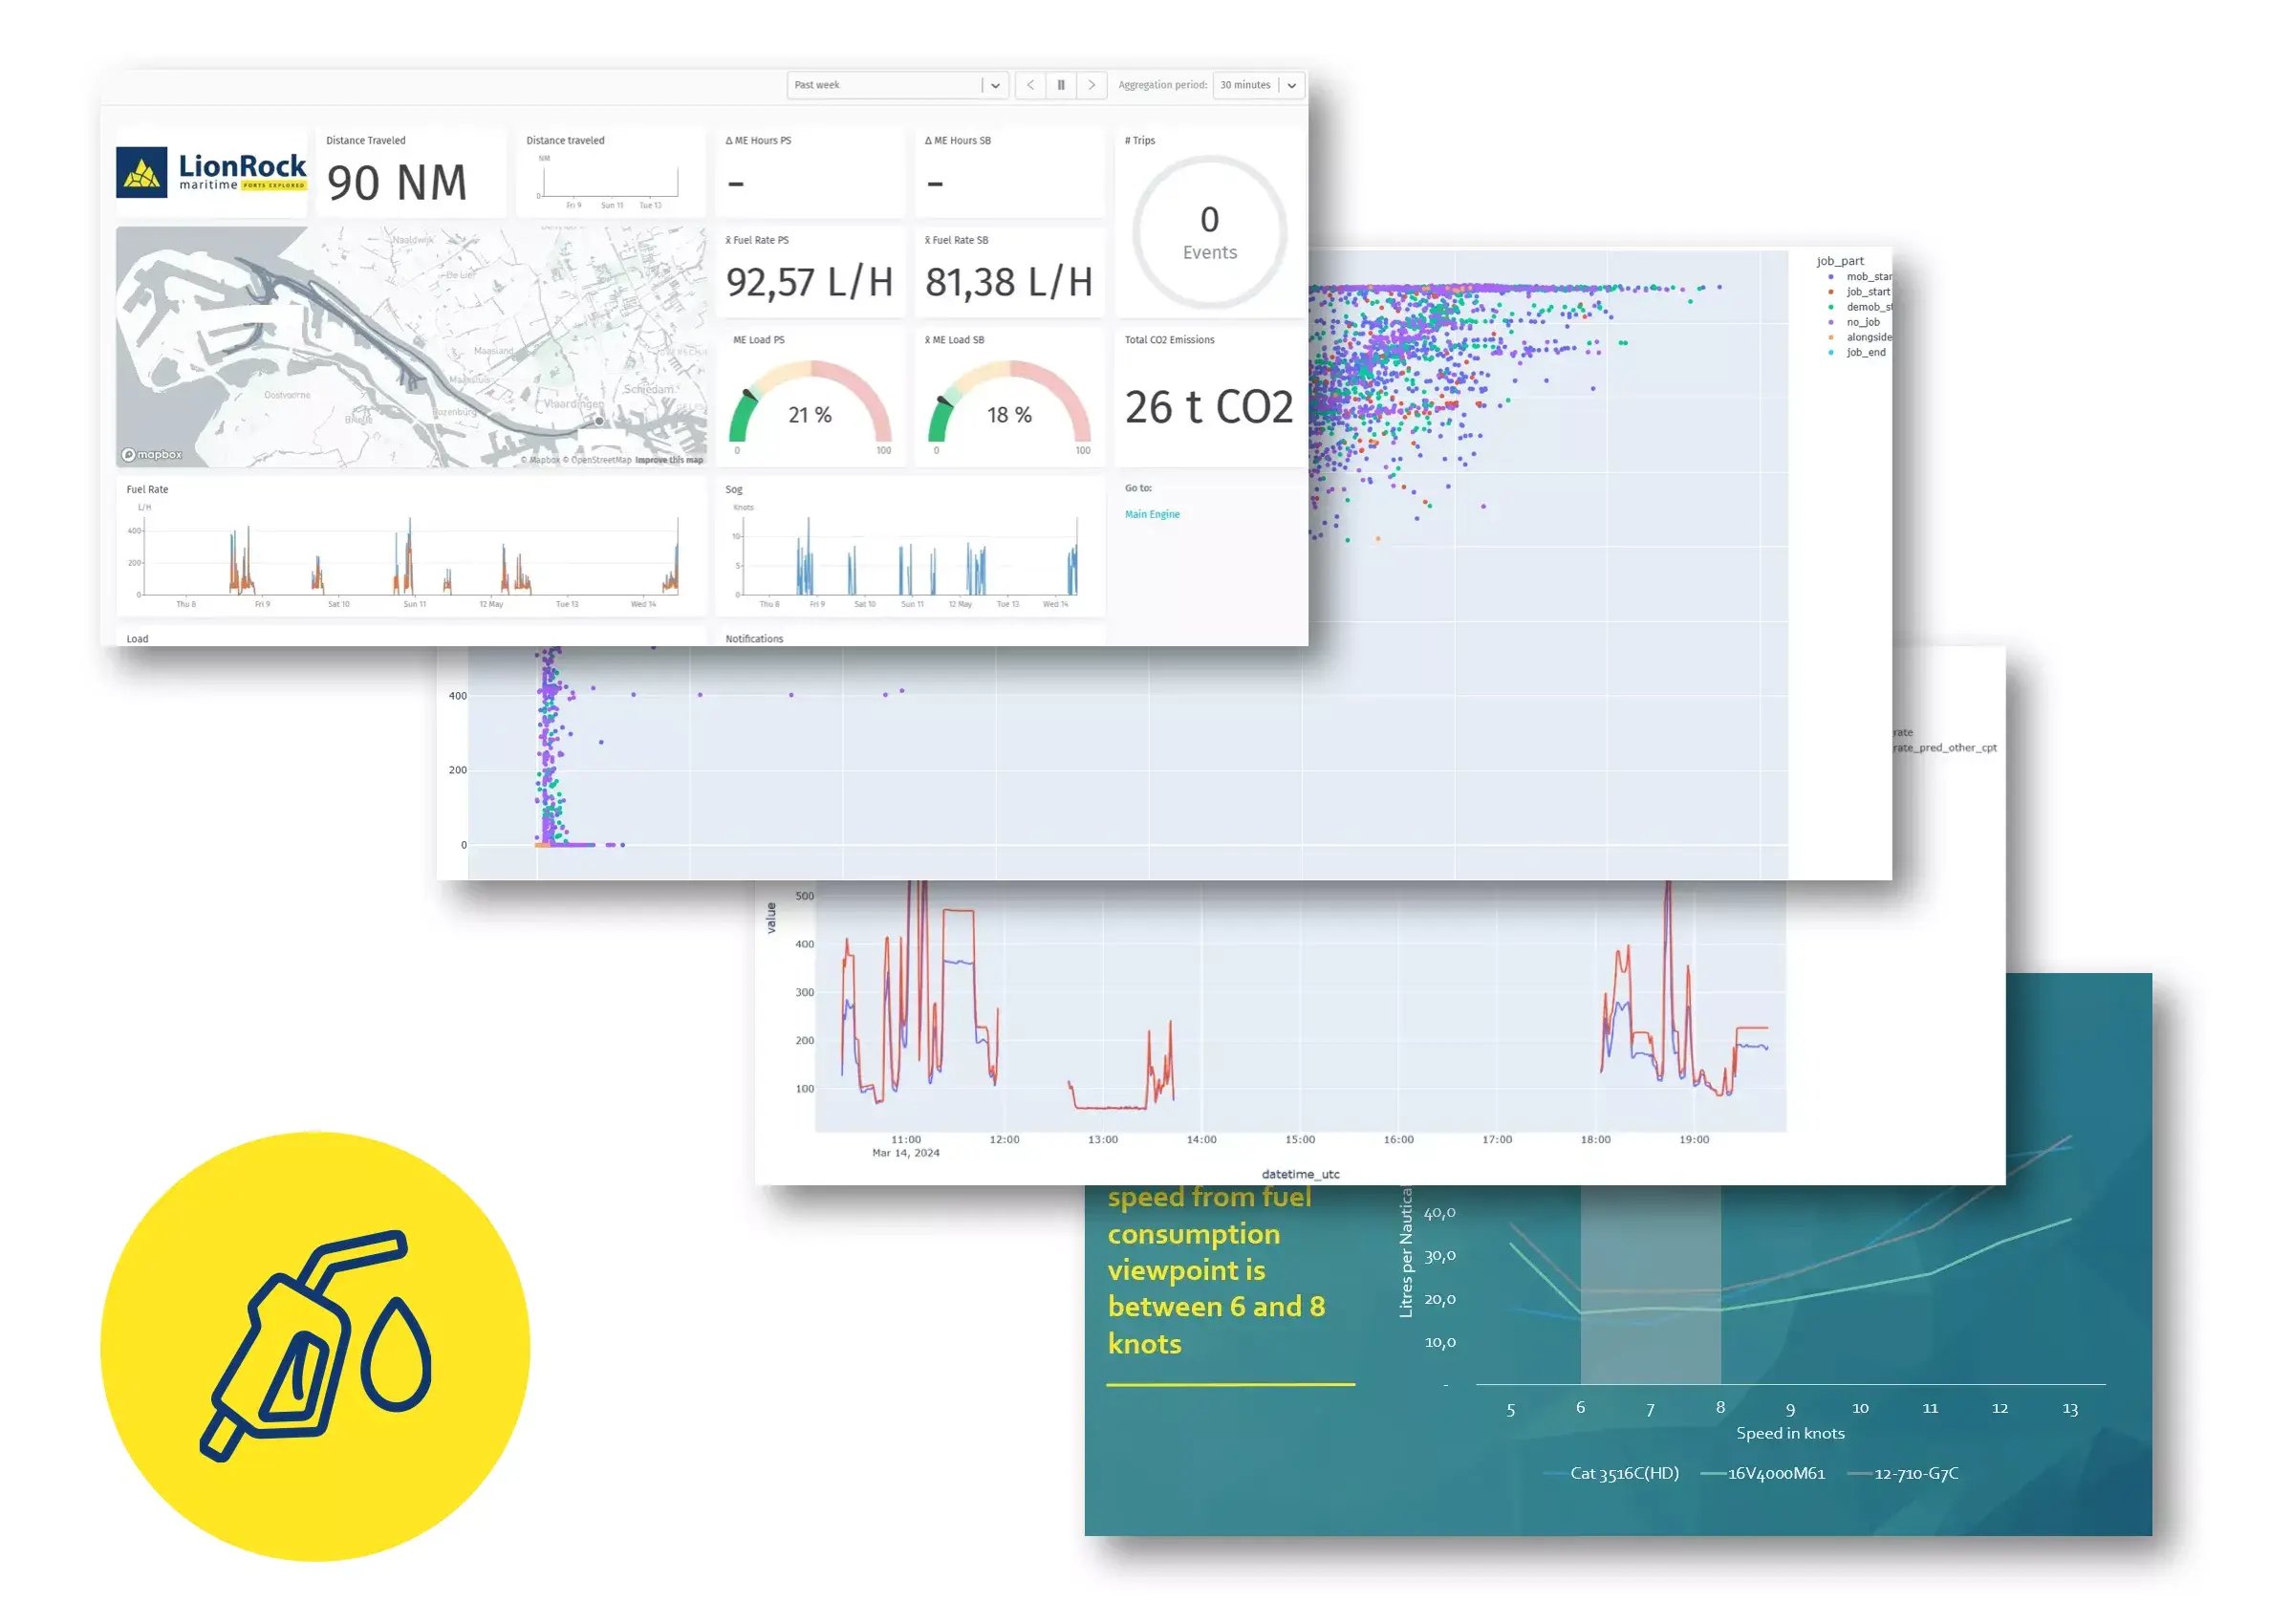
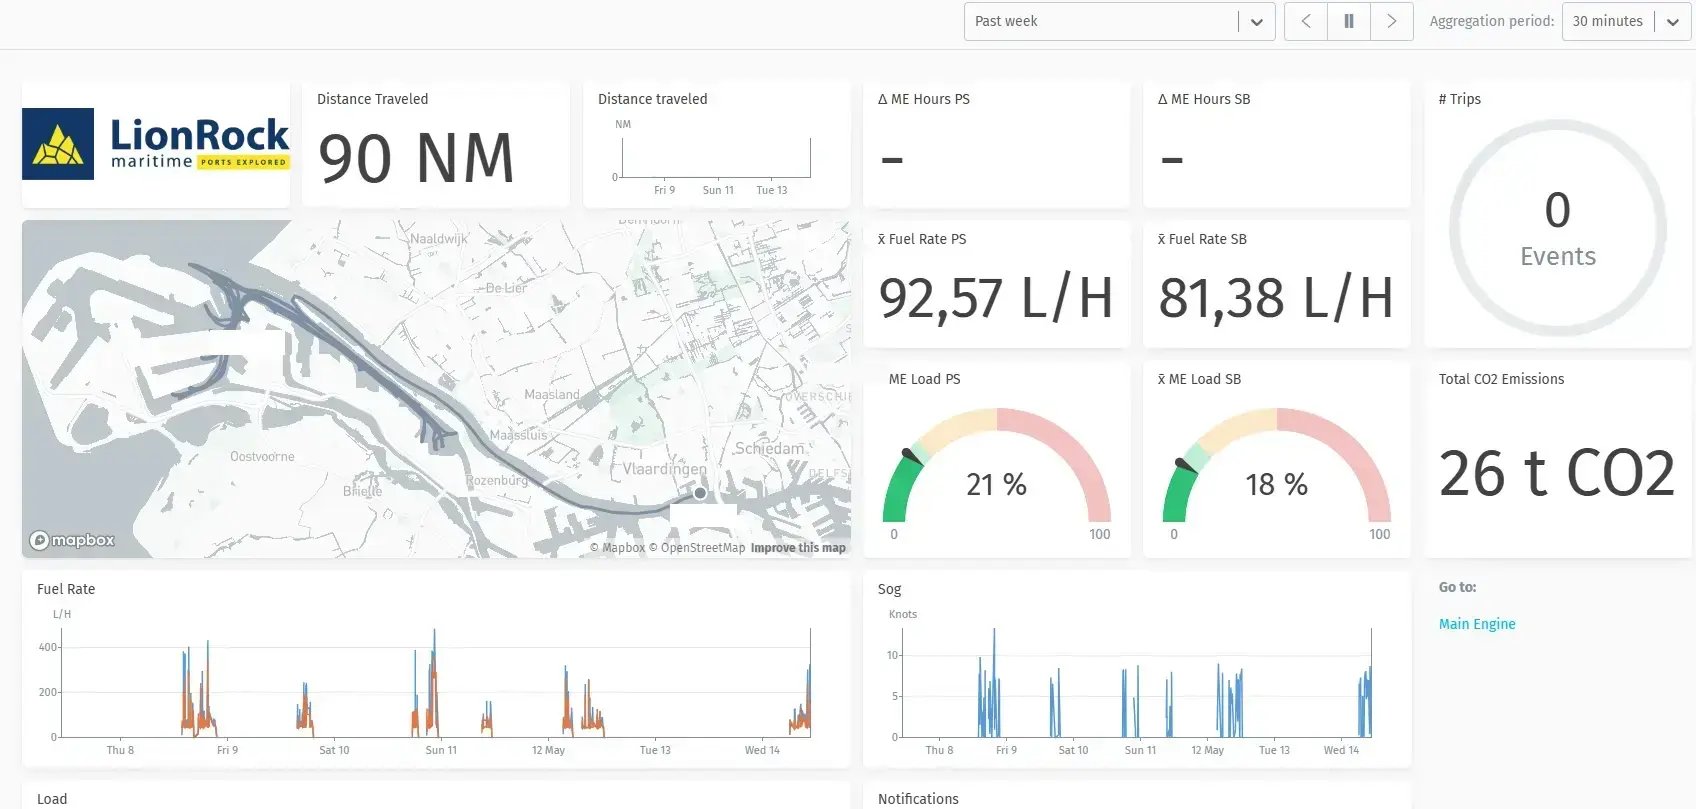
This report presents an example analysis using LionRock Maritime’s Tugboat Fuel Index, showing how port operators and tugboat managers can understand and act on fuel consumption data for operational and environmental benefits. By tracking fuel use patterns across vessels, validating models of fuel efficiency, and analyzing performance curves, the dashboard provides a robust framework for identifying best practices and areas for improvement.

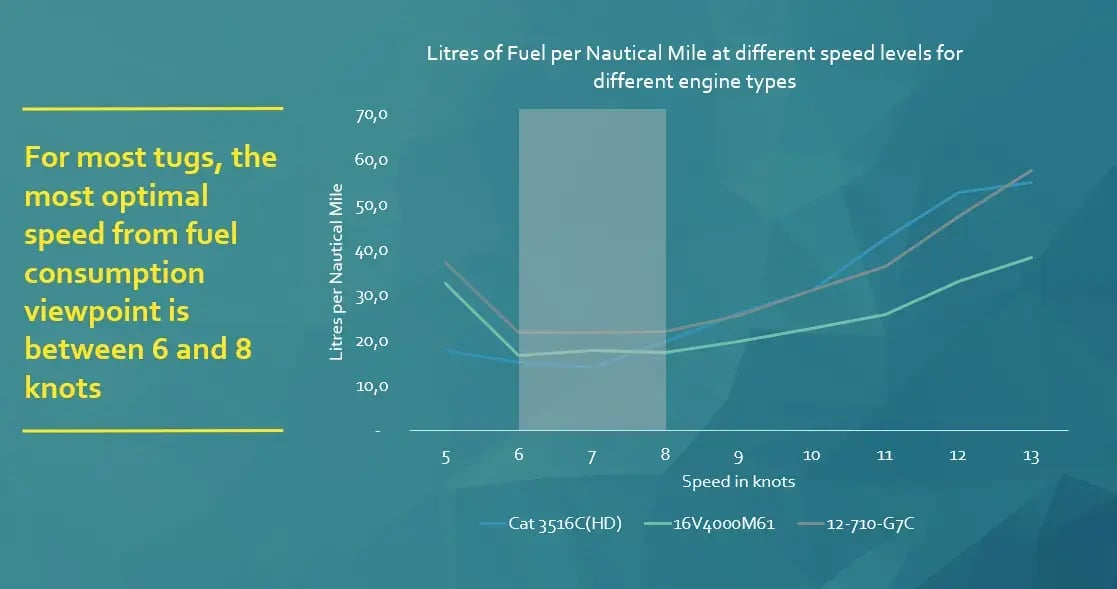
The analysis offers insights into operational scenarios, pinpointing optimal speed ranges for fuel efficiency, and highlighting potential savings. This proactive approach helps operators manage fleet deployment, improve contractual competitiveness, and demonstrate sustainability leadership. Overall, the Tugboat Fuel Index ensures that every fuel decision is an informed one, enabling smarter and more responsible port operations.

4.3.1_Fuel_use_by_tugboat copy

Insight 1

Fuel use by tugboat

The dashboard enables operators and managers to gain a clear and detailed understanding of fuel consumption patterns across their fleet. It aggregates data such as average fuel rate, load levels, distance traveled, and emissions, visualized through intuitive graphs and maps. By tracking these metrics in real-time or across selected periods, this insight helps identify peak usage periods, operational inefficiencies, and potential fuel-saving opportunities. With this data, teams can support informed decisions on voyage planning, load optimization, and sustainability efforts—ultimately leading to cost savings and improved environmental performance.

4.3.2_Fuel_consumption_analytics

Insight 2

Fuel consumption analytics

This dashboard offers a granular analysis of fuel consumption patterns across different job parts, operational segments, and vessel activities. By plotting data points for various operational conditions (such as job start, job end, alongside, and periods of inactivity), the dashboard reveals how tugboats consume fuel under different operational contexts.

This insight allows fleet managers to identify specific job phases or vessel behaviors that lead to higher fuel burn, guiding targeted interventions and operational refinements. Over time, it becomes a foundation for strategic decision-making—helping companies align vessel efficiency, crew performance, and environmental compliance with their broader commercial and sustainability targets.

4.3.3_Tugboat_fuel_efficiency_index_(model_validation)

Insight 3

Tugboat Fuel Efficiency Index (model validation)

This dashboard compares the actual fuel consumption (blue line) of a tugboat captain’s performance with predicted fuel rates based on another captain’s data (red line). By overlaying real-world operational data with a predictive model, the analysis identifies deviations and validates whether fuel-saving strategies or performance improvements are effectively translating to real savings on board.

For tug operators and fleet managers, this insight is crucial for confirming the reliability of operational efficiency models and detecting whether training or new practices are genuinely impacting fuel consumption. Over time, this validation tool supports data-driven decisions on crew performance, best-practice adoption, and ongoing fuel efficiency improvements.

4.3.4_Fuel_curve_analysis_by_tugboat

Insight 4

Fuel curve analysis by tugboat

The fuel curve analysis dashboard provides an in-depth view of fuel consumption rates for different engine types across varying speeds. For most tugboats, the data highlights that optimal fuel efficiency is typically achieved between speeds of 6 and 8 knots. This insight helps operators pinpoint the most eco-efficient operating range, enabling them to adjust sailing speeds to conserve fuel and reduce operational costs. By visualizing fuel consumption as a function of speed, this tool supports data-driven decisions around engine performance and voyage planning, ensuring that operations remain both cost-effective and environmentally responsible.

Included Reports

Insights we provide:

  • Fuel use by tugboat
  • Fuel consumption analytics
  • Tugboat fuel efficiency index (model validation)
  • Fuel curve analysis by tugboat